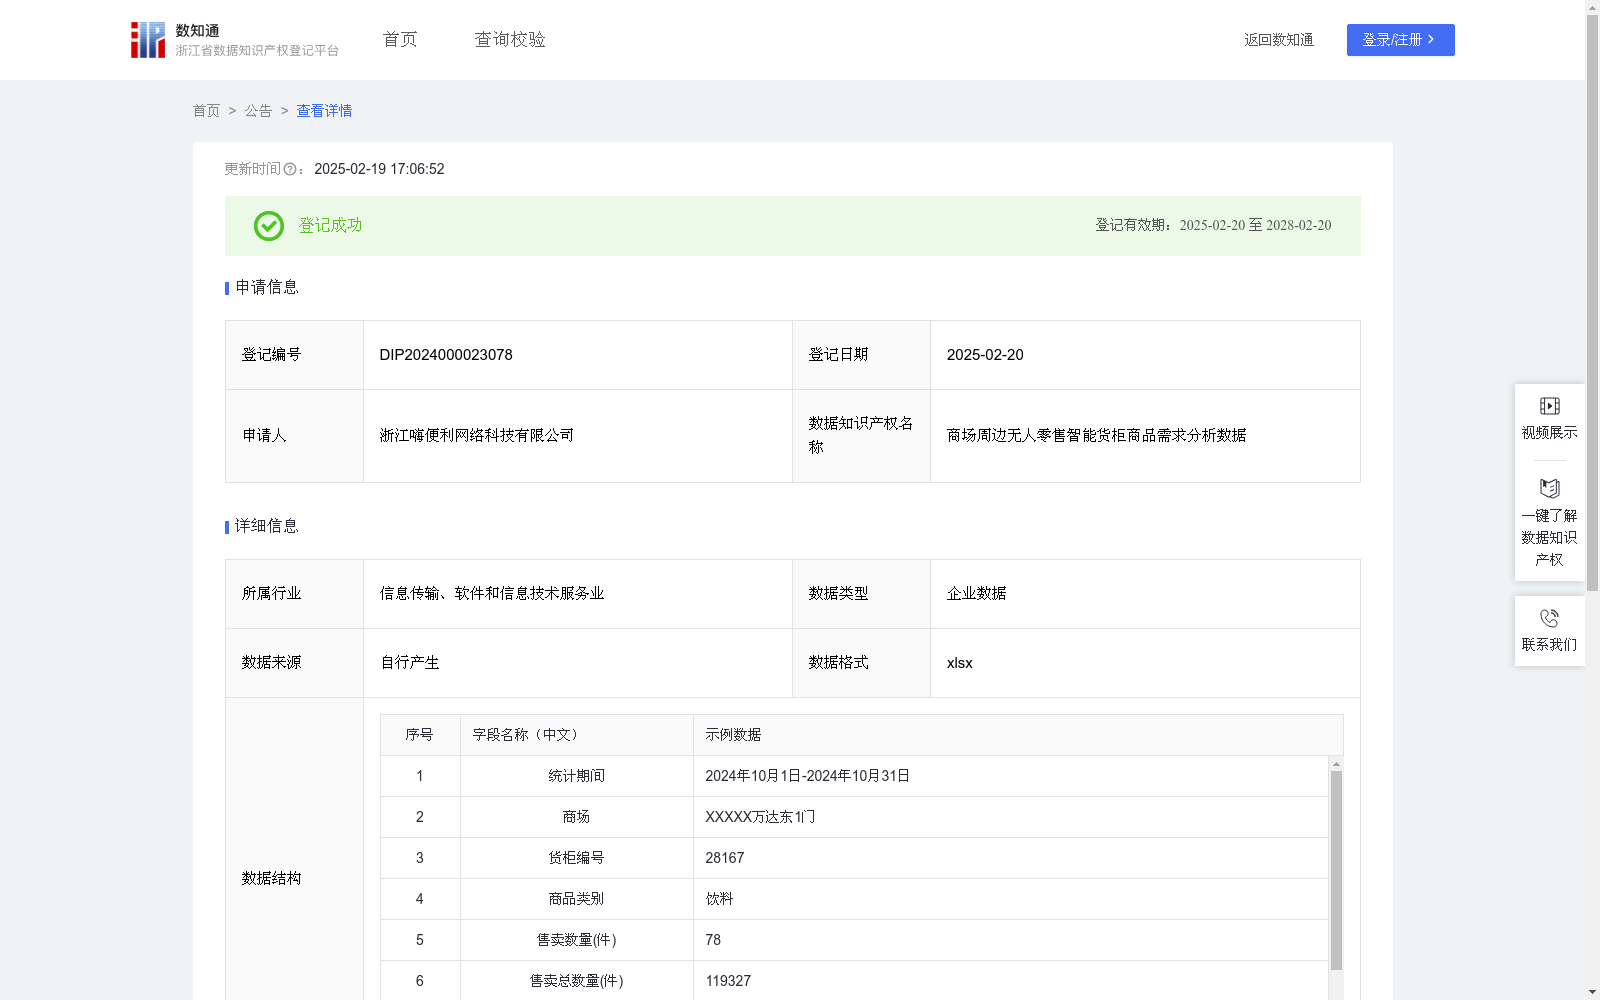
商场周边无人零售智能货柜商品需求分析数据
收藏浙江省数据知识产权登记平台2025-02-19 更新2025-02-20 收录
下载链接:
https://www.zjip.org.cn/home/announce/trends/113227
下载链接
链接失效反馈官方服务:
资源简介:
通过研究以及过往经验发现,不同生活场景下人们消费的商品类型也有很大差别,比如学校周边的主要消费的商品为零食、文具等,而商场周边的主要消费的商品为饮料、纸巾等,所以不同场景下人们的商品需求是无人零售智能货柜行业的一个重要关注点。本数据对各个商场周边无人零售智能货柜的售卖情况进行分析,从消费者对不同商品类别的选择中,可以得出不同商品类别的售卖占比,体现商场场景中商品的消费需求情况,帮助充实无人零售智能货柜的企业优化不同类型商品的投放比重,指导各商家在商场场景的智能货柜上合理分配不同类型商品的优惠方式、优惠力度及新品投放方案。
1、提取了统计区间内无人零售智能货柜有商品售出的数据,包含商场、货柜编号、商品类别、售卖数量四个字段,对统计区间内的数据聚合,其中数量字段为统计区间内本货柜该商品类型的累计交易件数,对售卖数量及商品类别字段进行分析,2、同类商品售卖数量是通过SUMIFS函数对相同商品类别的售卖数量的求和;3、商品售卖总数量是通过SUM函数将数据统计范围内所有售卖数量求和;4、同类商品售卖数量占比=同类商品售卖数量/售卖总数量*100%;5、商品需求等级运用了ABC分类法,对同类商品售卖数量占比≥40%的,给予“A级”的评价,对40%>同类商品售卖数量占比≥20%区间的,给予“B级”的评价,同类商品售卖数量占比<20%的,给予“C级”的评价。
Based on research and practical experience, it is found that there are significant differences in the types of goods consumed by people in different daily scenarios. For example, the main goods consumed around schools are snacks, stationery and other items, while the main goods consumed around shopping malls are beverages, tissues and other items. Therefore, consumers' product demand in different scenarios is a key focus of the unmanned retail smart cabinet industry.
This dataset analyzes the sales performance of unmanned retail smart cabinets around various shopping malls. By examining consumers' choices across different product categories, the sales proportion of each product category can be derived, which reflects the consumer demand patterns of goods in shopping mall scenarios. This helps enterprises operating unmanned retail smart cabinets optimize the stocking ratio of different product categories, and guides merchants to reasonably allocate preferential strategies, discount intensities and new product launch plans for different types of goods on smart cabinets in shopping mall scenarios.
1. Data of unmanned retail smart cabinets with completed sales during the statistical period is extracted, including four fields: shopping mall, cabinet ID, product category, and sales volume. The data within the statistical period is aggregated, where the sales volume field refers to the cumulative transaction volume of this product category in this cabinet during the statistical period. Analysis is conducted on the sales volume and product category fields.
2. The sales volume of the same product category is calculated by summing the sales volumes of identical product categories using the SUMIFS function.
3. The total sales volume of all products is obtained by summing all sales volumes within the statistical data scope using the SUM function.
4. The sales proportion of a product category = (sales volume of the product category / total sales volume) * 100%.
5. The ABC classification method is applied to determine the product demand level: products with a sales proportion ≥ 40% are rated as "Grade A"; those with a sales proportion ranging from 20% (inclusive) to 40% (exclusive) are rated as "Grade B"; and those with a sales proportion < 20% are rated as "Grade C".
提供机构:
浙江嗨便利网络科技有限公司
创建时间:
2024-12-13
搜集汇总
数据集介绍
特点
该数据集包含574条记录,每月更新,记录了商场周边无人零售智能货柜的商品售卖情况,通过分析商品类别、售卖数量等数据,计算同类商品售卖数量占比和商品需求等级,帮助企业优化商品投放策略。
以上内容由遇见数据集搜集并总结生成


