ChinaSoybeanYield1km: a 1-km annual soybean yield dataset from 2001 to 2020 in China
收藏资源简介:
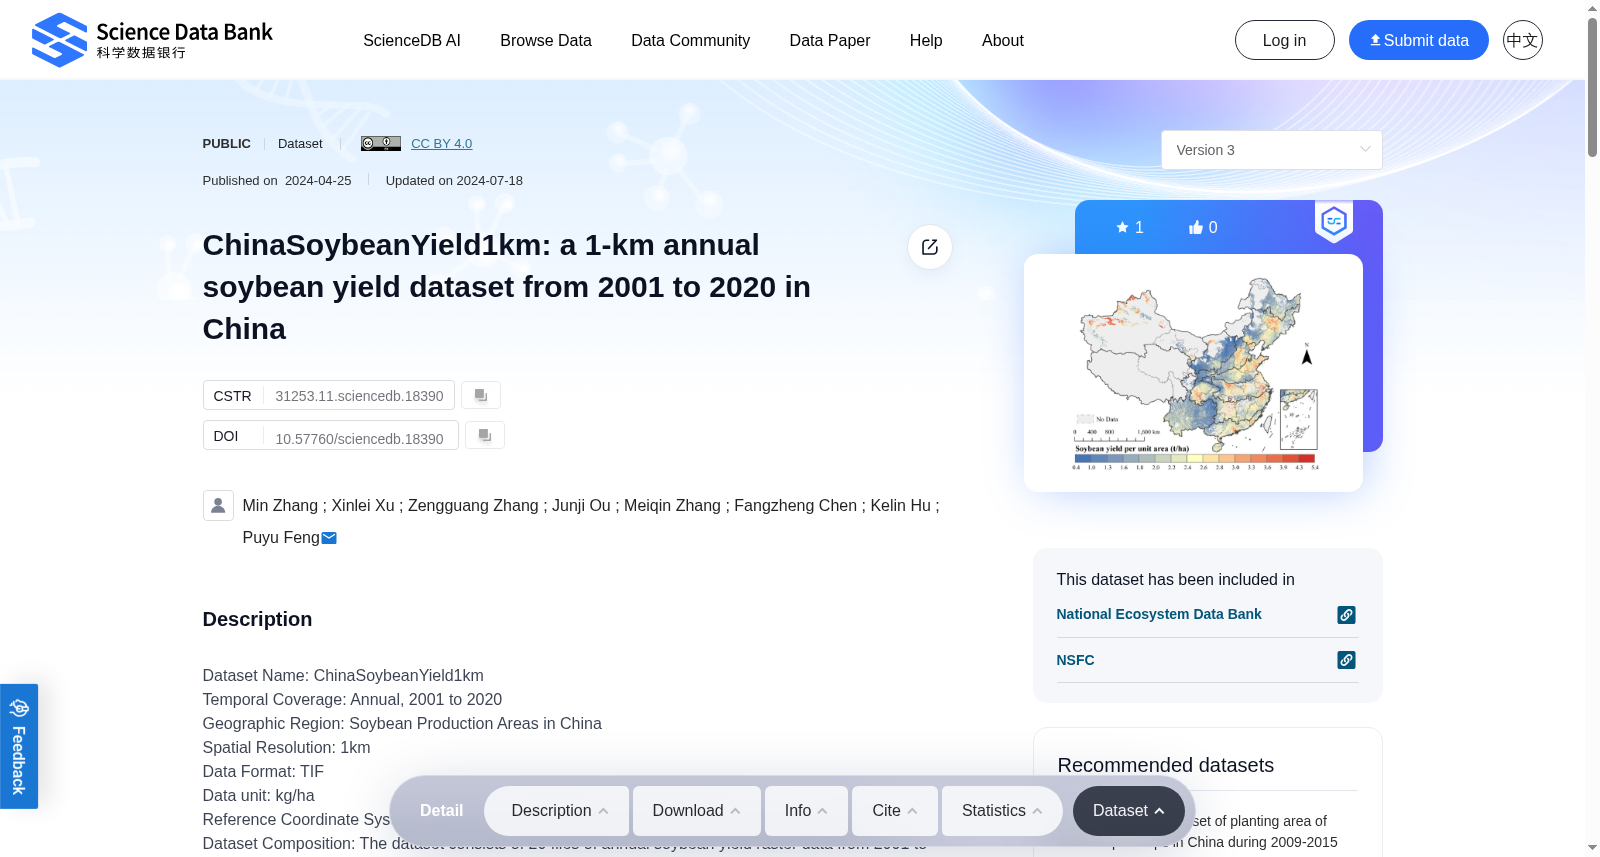
Dataset Name: ChinaSoybeanYield1kmTemporal Coverage: Annual, 2001 to 2020Geographic Region: Soybean Production Areas in ChinaSpatial Resolution: 1kmData Format: TIFData unit: kg/haReference Coordinate System: Projected Coordinate System (WGS_1984_UTM_Zone_49N)Dataset Composition: The dataset consists of 20 files of annual soybean yield raster data from 2001 to 2020 in China, with "Soybean_year.tif" representing the yearly soybean yield raster data.Data Generation Process: First, we collected climate, remote sensing, management, soil and municipal-level statistical soybean yield data as modelling data. Second, we divided China into three main soybean production regions. For each region, 20 individual machine learning-based yield estimation models were developed according to the modeling process of a data-driven model. In this step, well-performed models were further selected as base models and meta-models. Third, the number of base variables and the types of input variables were determined to develop the final ensemble learning model for each region .Finally, this study utilized ensemble learning models to generate annual simulated soybean yield maps. These maps were employed as weights for spatial disaggregation of municipal-level statistical data, resulting in the generation of a yearly rasterized soybean yield dataset for China from 2001 to 2020 with a spatial resolution of 1km. The results indicate that at the county level, ChinaSoybeanYield1km has an R² of approximately 0.50 and an RMSE of 0.61t/ha, while EarthStat, MapSPAM, and GDHY have RMSE values of 0.75 t/ha, 0.80 t/ha, and 1.19t/ha, respectively. In comparison, the accuracy of the soybean yield dataset generated in this study at 1km resolution is higher.
数据集名称:中国1公里分辨率大豆产量数据集(ChinaSoybeanYield1km) 时间覆盖范围:2001年至2020年年度数据 地理覆盖区域:中国大豆主产区 空间分辨率:1公里 数据格式:TIF格式 数据单位:千克/公顷(kg/ha) 参考坐标系:投影坐标系(WGS_1984_UTM_Zone_49N) 数据集组成:本数据集包含2001至2020年共20份中国年度大豆产量栅格数据文件,文件命名规则为"Soybean_year.tif",其中"year"替换为对应年份,文件内容即为该年度的大豆产量栅格数据。 数据生成流程:首先,收集气候、遥感、田间管理、土壤及市级统计大豆产量数据作为建模数据源;其次,将中国划分为三大大豆主产区,针对每个产区基于数据驱动模型的建模流程,构建20个独立的基于机器学习的产量估算模型,在此步骤中进一步筛选性能优异的模型作为基模型与元模型;第三,确定基变量数目与输入变量类型,为各产区构建最终的集成学习模型;最后,本研究利用集成学习模型生成年度模拟大豆产量分布图,并将其作为权重用于市级统计数据的空间离散化处理,最终生成2001至2020年中国1公里分辨率的年度栅格化大豆产量数据集。 研究结果表明,在县级尺度下,该数据集的决定系数(coefficient of determination, R²)约为0.50,均方根误差(Root Mean Square Error, RMSE)为0.61吨/公顷;而EarthStat、MapSPAM及GDHY的RMSE分别为0.75吨/公顷、0.80吨/公顷与1.19吨/公顷。相较之下,本研究生成的1公里分辨率大豆产量数据集精度更优。