
dant555/flipfinder-usa
收藏Hugging Face2026-04-11 更新2026-04-12 收录
下载链接:
https://hf-mirror.com/datasets/dant555/flipfinder-usa
下载链接
链接失效反馈官方服务:
资源简介:
---
license: cc-by-4.0
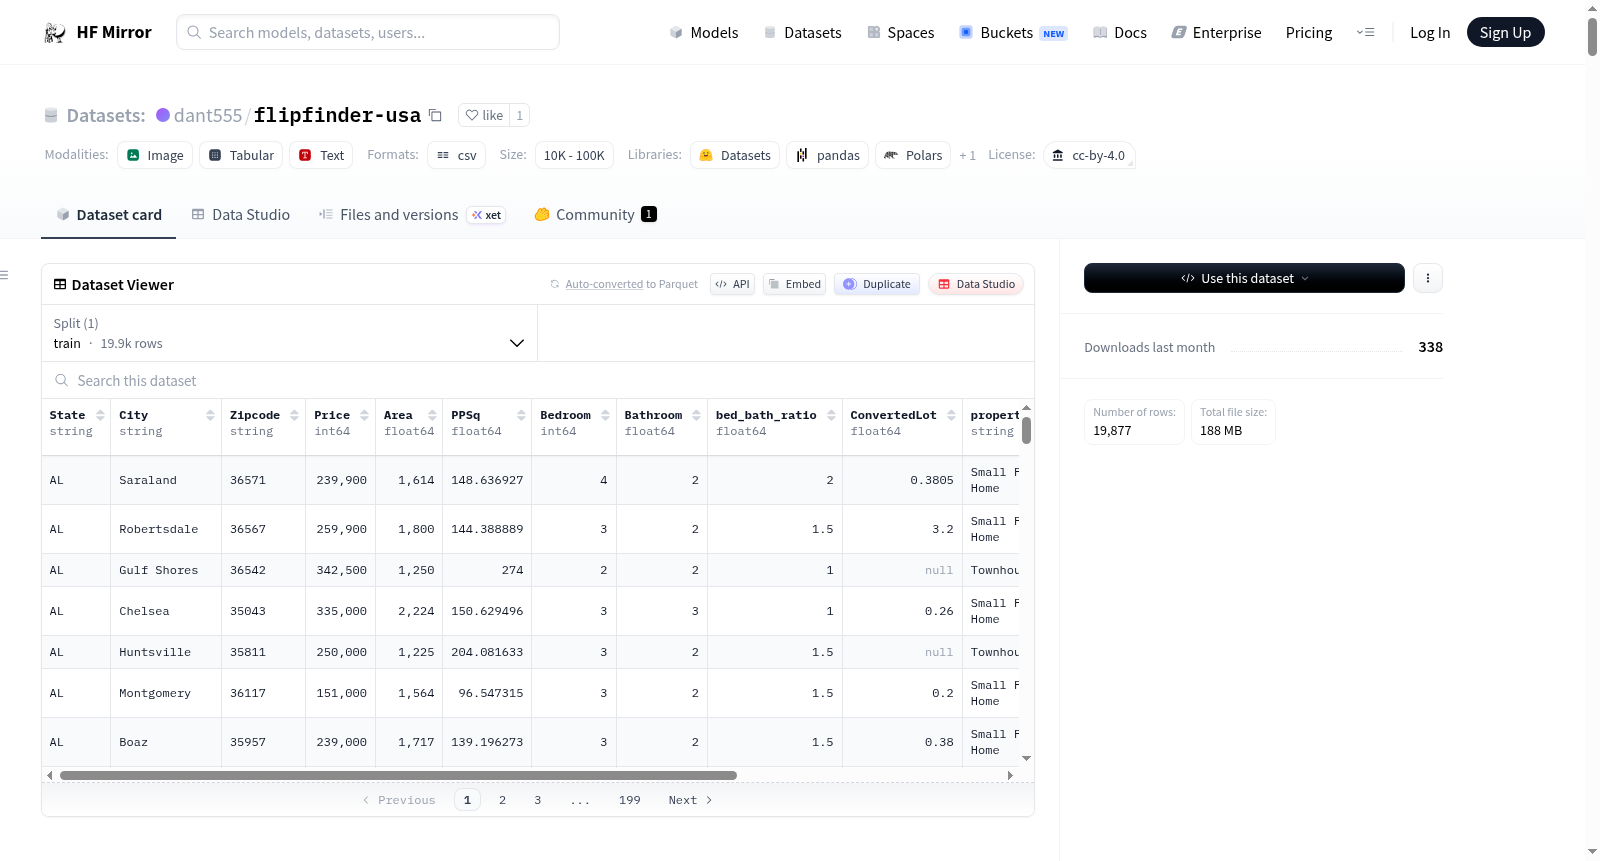
configs:
- config_name: default
data_files:
- split: train
path: flipfinder_usa_cleaned.csv
default_config: true
features:
- name: State
dtype: string
- name: City
dtype: string
- name: Zipcode
dtype: string
- name: Price
dtype: int64
- name: Area
dtype: float64
- name: PPSq
dtype: float64
- name: Bedroom
dtype: int64
- name: Bathroom
dtype: float64
- name: bed_bath_ratio
dtype: float64
- name: ConvertedLot
dtype: float64
- name: property_type
dtype: string
- name: is_good_flip
dtype: int64
- name: Latitude
dtype: float64
- name: Longitude
dtype: float64
---
## 🎥 Project Walkthrough Video
<video src="https://huggingface.co/datasets/dant555/flipfinder-usa/resolve/main/flipfinder_presentation.mp4" controls="controls" style="max-width: 720px;"></video>
# 🏠 FlipFinder USA
### Identifying Undervalued Real Estate Investment Opportunities Across the United States
**Author:** Dan | **HuggingFace:** [@dant555](https://huggingface.co/dant555)
---
## 📋 Project Overview
This project transforms a general-purpose Zillow real estate dataset into a focused investment screening tool. Using Exploratory Data Analysis (EDA), I engineered a binary target variable (`is_good_flip`) to identify properties that are genuinely underpriced relative to their immediate local market - potential candidates for a buy-renovate-sell (flip) investment strategy.
---
## ❓ The Question I Want to Answer
> **Should I buy this property or not (is it a good real estate flip opportunity)?**
---
## 📦 Dataset
- **Source:** [United States House Listings: Zillow Extract 2023](https://www.kaggle.com/datasets/febinphilips/us-house-listings-2023) - Kaggle
- **Raw size:** 24,000+ rows × 16 features
- **Cleaned size:** ~19,877 rows × 14 features (11 from Original + 3 New)
- **Type:** Numeric tabular data
### Key Features
| Feature | Type | Description |
|---|---|---|
| State | Categorical | 2-letter US state abbreviation (e.g. CA, NY, TX) |
| City | Categorical | City in which the property is located |
| Zipcode | Categorical | 5-digit US ZIP code, stored as string to preserve leading zeros |
| Price | Numerical | Listed asking price of the property in USD |
| Area | Numerical | Interior living area measured in square feet |
| PPSq | Numerical | Price per square foot, calculated as Price / Area |
| Bedroom | Numerical | Number of bedrooms in the property |
| Bathroom | Numerical | Number of bathrooms, including half baths (e.g. 1.5, 2.5) |
| bed_bath_ratio | Numerical | Ratio of bedrooms to bathrooms, proxy for layout density |
| ConvertedLot | Numerical | Lot size in acres, missing for many urban/condo properties |
| property_type | Categorical | Size-based category: Condo/Small Property, Townhouse, Small Family Home, Large Family Home |
| is_good_flip | Categorical | Binary target variable: 1 = Good Flip Opportunity, 0 = Not a Good Flip |
| Latitude | Numerical | Geographic latitude coordinate for spatial mapping |
| Longitude | Numerical | Geographic longitude coordinate for spatial mapping |
---
## 🎯 Target Variable - `is_good_flip`
Since the dataset has no built-in classification target, I engineered my own binary label. My first instinct was to use Zillow's `zestimate` column as the benchmark - but 8,594 values were missing, making it unreliable.
Instead, `is_good_flip` is defined as follows:
- Calculate each property's **Price Per Square Foot (PPSq)**
- Group by **5-digit ZIP + Bedroom count** to find the local market median (minimum 5 properties)
- Fall back to **5-digit ZIP only** if the primary group is too small
- Fall back to **3-digit ZIP prefix** if still too small
- Label **1 (Good Flip)** if PPSq is ≥ 15% below the local median
- Label **0 (Not a Good Flip)** otherwise
**27.3%** of properties were labeled as good flip opportunities.
---
## 🧹 Section 2: Data Wrangling
- Dropped columns with excessive missing values (`MarketEstimate`, `RentEstimate`) and redundant columns (`LotArea`, `LotUnit`, `Street`)
- Dropped rows with missing values in 8 critical columns: `Price`, `Area`, `PPSq`, `Bedroom`, `Bathroom`, `Zipcode`, `Latitude`, `Longitude`
- Restored East Coast ZIP codes with leading zeros (e.g. `02886`) lost during float conversion
- Validated all coordinates within US geographic boundaries (including Alaska)
- Applied 7 domain-specific filters to focus on realistic flip candidates:
- Price: $50,000 - $2,000,000
- Area: 400 - 5,000 sqft
- PPSq: $10 - $2,000
- Bedrooms: 1 - 8
- Bathrooms: 1 - 5
- Bed/Bath ratio: ≤ 4:1
- Lot size: 0.01 - 5 acres
**Before cleaning - outliers clearly visible across all features:**

**After cleaning - distributions are tighter and more meaningful:**

---
## 🔄 Section 3: Data Transformation
Both `Price` and `PPSq` were identified as strongly right-skewed distributions. To normalize them, I applied a log transformation using `np.log1p`, storing the results as `log_Price` and `log_PPSq` for potential future modeling use. All EDA and business analyses continue to use the original dollar values for interpretability.
---
## ⚙️ Section 4: Feature Engineering
To enrich the dataset for analysis, I engineered two new columns. The binary target variable `is_good_flip` is fully described in the Target Variable section above. Additionally, I created `property_type`: a categorical column classifying each property into one of four size-based categories based on living area: Condo/Small Property (under 800 sqft), Townhouse (800-1,500 sqft), Small Family Home (1,500-2,500 sqft), and Large Family Home (above 2,500 sqft).
## 📊 Section 5: Descriptive Statistics
To understand relationships between features, I generated a correlation heatmap across all numeric variables including the target variable `is_good_flip`. This revealed that no single feature has a strong linear correlation with the target - suggesting the flip signal is driven by a combination of variables rather than any one feature alone.

> The weak individual correlations with `is_good_flip` are not a problem - they reflect that flip opportunity is a threshold-based, hyper-local signal that linear correlation cannot capture.
---
## 📈 Section 6: Exploratory Visualization
**Price Distribution:** The listing price distribution is strongly right-skewed, with most properties clustered between $100K and $600K. The median price of $335,000 sits well below the mean of $390,550, confirming the right skew caused by a tail of higher-priced properties.

> The peak of the distribution falls around $250K-$300K - the sweet spot for realistic flip investment candidates.
---
**Properties by State:** The waffle chart displays all 49 represented US states, with each square colored by its good flip rate. The dataset is well balanced across states, with between 280 and 480 properties per state.

> Flip rates range from 17.5% to 37.6% across states - a 20 percentage point spread confirming that geography is a meaningful variable worth investigating further.
---
## 🔍 Section 7: Bivariate Exploration
**PPSq Distribution by Flip Status:** I compared the price per square foot distribution between good flip and non-flip properties to verify the target variable is working correctly and that the two groups are meaningfully separated.

> Good flip properties have a median PPSq of $119/sqft vs $206/sqft for non-flips - a clear and significant separation confirming the target variable is well-engineered.
---
**Feature Distributions by Flip Status:** I examined how Price, Area, Bedroom, and Bathroom distributions differ between good flip and non-flip properties using violin plots to show the full distribution shape of each group.

> Good flips have a significantly lower median price ($239,900 vs $365,000) and slightly larger area (2,040 vs 1,750 sqft). Bedroom and bathroom counts are identical across both groups - confirming layout alone does not drive the flip signal.
---
**Bed/Bath Ratio & Flip Rate:** I examined whether the bedroom-to-bathroom ratio - a proxy for layout density and renovation age - is associated with higher flip rates across five ratio categories.

> Dense layouts with a ratio above 3.0 show a 53.7% flip rate - nearly double the dataset average of 27.3% - confirming that older, under-renovated homes are systematically underpriced in their local markets.
---
**Threshold Validation:** To verify that the 15% threshold used to define `is_good_flip` is well-calibrated and not arbitrary, I visualized the actual PPSq deviation from local median for both groups.

> The typical good flip sits at -29.8% below its local median - nearly double the 15% minimum - confirming the threshold is conservative and creates a clean, meaningful separation between the two classes.
---
## ❓ Section 8: Multivariate Exploration & Research Questions
### Q1 - Which ZIP codes have the highest concentration of good flip opportunities?
I calculated the flip rate for every ZIP code with at least 10 properties to ensure statistical reliability, then ranked the top 15 performers.

> ZIP code 58554 (ND) leads at 47.1%, followed by 19975 (DE) and 02886 (RI) both at 46.2%. Every ZIP code in the top 15 exceeds the dataset average by at least 13 percentage points - confirming that micro-market selection is critical for investors.
---
### Q2 - Which states offer the most good flip opportunities?
I mapped the good flip rate for all 49 states on an interactive choropleth map to reveal geographic clustering patterns that a table or bar chart cannot convey.

> Maine (37.6%), Oregon (33.8%), and Vermont (33.6%) lead all states. Nevada (17.5%) is the weakest market. A clear Northeast and Pacific Northwest vs Sun Belt divide emerges - Sun Belt states that experienced rapid price appreciation show the lowest flip rates.
---
### Q3 - What does a typical good flip opportunity look like?
I used a 2D KDE contour plot to map the concentration of good flip opportunities in the Price vs Area space, revealing where flip candidates cluster most densely.

> Good flip opportunities cluster tightly around $237,000 and ~2,000 sqft. Properties above $500K become increasingly rare as flip candidates regardless of size or layout - confirming that good flips are concentrated in the affordable, mid-size segment of the market.
---
### Q4 - Which layout is most associated with good flip opportunities?
I calculated the good flip rate for each property type category to understand whether property size influences the likelihood of a listing being underpriced relative to its local market.

> Large Family Homes above 2,500 sqft show the highest flip rate at 37.2% - nearly three times higher than Condo/Small Properties at 13.0%. Larger, older homes with dense bedroom layouts are the prime flip targets, likely because they require more renovation capital which suppresses buyer competition.
---
### 🗺️ Geographic Distribution of Good Flip Opportunities
I plotted every good flip property on an interactive US map, encoding PPSq as color and listing price as bubble size, to provide a direct investment screening tool.

> Good flip opportunities exist nationwide. Dark green dots (low PPSq) dominate the Midwest and South, representing the most affordable entry points. The single large red dot on the West Coast captures a rare high-PPSq flip in an expensive urban market.
---
## 📝 Section 9: Communication of Insights
**Finding 1 - Geography is the strongest driver**
The most powerful predictor of flip opportunity is geographic location. Maine leads all states at 37.6% while Nevada sits at the bottom at just 17.5% - a 20 percentage point gap. The Northeast and Pacific Northwest consistently outperform the Sun Belt, where recent price appreciation has reduced the availability of underpriced listings. At the micro-market level, ZIP code 58554 (ND) leads all areas at 47.1%, followed by 19975 (DE) and 02886 (RI) both at 46.2%. Every ZIP code in the top 15 exceeds the dataset average by at least 13 percentage points, confirming that micro-market selection is as important as state-level selection.
**Finding 2 - Property size and type drive flip rate**
There is a clear and consistent relationship between property size and flip opportunity rate. Large Family Homes above 2,500 sqft have a flip rate of 37.2% - nearly three times higher than Condo/Small Properties at 13.0%, with Townhouses at 19.6% and Small Family Homes at 28.3% falling in between. Larger properties are more likely to be underpriced relative to their local market because they require more renovation capital, suppressing buyer competition and listing price below the local median.
**Finding 3 - Layout efficiency is an independent flip signal**
Beyond size, the bedroom-to-bathroom ratio adds a separate and even stronger signal. Dense layouts with a ratio above 3.0 reach a 53.7% flip rate - nearly double the dataset average - independently of property size. This ratio captures the renovation age and efficiency of a property in a way that size alone cannot. Properties with many bedrooms relative to bathrooms are hallmarks of older, under-renovated homes that have not kept pace with modern buyer expectations, creating systematic pricing gaps relative to their local market.
**Finding 4 - The flip signal is threshold-based, not linear**
The weak individual correlations observed in the heatmap are explained by the fact that `is_good_flip` is driven by the combination of price, area, and local market context - not by any single feature alone. Good flips cluster tightly below $237,000 and around 1,996 sqft, with a median PPSq of $119/sqft compared to $206/sqft for non-flips. The concentration is tight and well-defined, confirming that flip opportunities occupy a specific and narrow price-size window in the market.
**Finding 5 - Price is the strongest individual separator**
Among all individual features, listing price shows the clearest separation between good flip and non-flip properties. Good flip properties have a median price of $239,900 compared to $365,000 for non-flips - a difference of over $125,000. This tells investors that the typical good flip opportunity is concentrated in the affordable segment of the market, and properties priced above $500,000 become increasingly rare as flip candidates regardless of their size or layout.
**Finding 6 - Lot size is not a predictor of flip opportunity**
Unlike price, size, and layout - lot size shows virtually no difference between good flip and non-flip properties. Both groups share an identical median lot size of 0.25 acres and their distributions are nearly indistinguishable. This is a valuable null finding - it tells investors that filtering by lot size is not a useful screening criterion when searching for flip opportunities, and that their focus should remain on price per square foot relative to the local market median.
---
## ⚠️ Limitations
- Dataset captures **listing prices**, not final sale prices
- **Hawaii** is not represented in this extract
- **Missing lot sizes** for many urban/condo properties
- **Zestimate** had too many missing values to use as benchmark
- Dataset is a **static 2023 snapshot** - market conditions may have changed
- Local medians are based on **dataset sample**, not complete Zillow database
---
## 📁 Repository Contents
| File | Description |
|---|---|
| `flipfinder_usa_cleaned.csv` | Cleaned dataset ready for analysis |
| [Dan's_Assignment_1_EDA_&_Dataset.ipynb](https://colab.research.google.com/drive/1G8vJOB68FHK-YB_uBmcuU4qFs53yPg_y?usp=sharing) | Full EDA notebook with all code and explanations |
| `Plots/` | Visualization images used in this README |
## 🚀 How to Run
1. Open the `.ipynb` file in Google Colab or Jupyter Notebook
2. Upload your `kaggle.json` credentials file when prompted
3. Run all cells from top to bottom
4. All visualizations and findings will be generated automatically
---
*Project by Dan | FlipFinder USA | 2025*
提供机构:
dant555
搜集汇总
数据集介绍
构建方式
在房地产投资分析领域,FlipFinder-USA数据集源于对Zillow原始房产列表数据的深度重构。该数据集以2023年美国房屋挂牌数据为基础,通过系统性的数据清洗与特征工程,构建了一个专注于识别翻新投资机会的标注数据集。构建过程首先剔除了缺失值过多的列与行,并应用了七项基于领域知识的过滤规则,确保数据聚焦于实际可行的投资标的。核心目标变量is_good_flip通过计算每个房产相对于其本地市场中位数价格每平方英尺的偏离度来定义,具体以五位数邮政编码和卧室数量作为分组基准,并设置了15%的价格阈值进行二分类标注,最终约27.3%的样本被标记为优质投资机会。
特点
该数据集呈现出多维度、高信息密度的特点,涵盖了地理、物理属性与市场指标等多个层面。其包含州、城市、邮政编码等地理标识,以及价格、面积、卧室与卫生间数量等关键物理特征,并衍生出价格每平方英尺、卧室卫生间比例等计算指标。尤为突出的是,数据集通过属性类型分类与经纬度坐标,实现了对房产规模与空间位置的精细化描述。目标变量is_good_flip的构建基于超本地化的市场比较,有效捕捉了因房产老旧、布局密集或地处特定区域而产生的系统性价格低估信号,使得数据集不仅记录了房产静态属性,更蕴含了动态的市场相对价值信息。
使用方法
该数据集主要服务于房地产投资分析与机器学习建模任务。研究者可将其用于开发分类模型,以预测房产是否具备翻新投资潜力;亦可进行探索性数据分析,深入挖掘不同地理区域、房产类型与市场条件对投资机会的影响。在使用时,建议重点关注价格、面积及价格每平方英尺等核心数值特征,并结合邮政编码与经纬度进行空间分析。数据集中已提供的对数变换特征(log_Price, log_PPSq)可直接用于缓解数据偏态,提升模型性能。用户需注意数据集的局限性,如仅反映挂牌价格、缺少夏威夷数据等,并应在理解目标变量构建逻辑的基础上,结合领域知识对分析结果进行审慎解读。
背景与挑战
背景概述
FlipFinder USA数据集于2025年由研究人员Dan构建并发布,其核心目标在于识别美国房地产市场中具有潜在投资价值的房产翻新机会。该数据集源自2023年的Zillow房产挂牌数据,经过精心清洗与特征工程,构建了二元目标变量`is_good_flip`,用以标注相对于当地市场中位数价格被低估的房产。这一工作将通用的房产数据转化为专注于投资筛选的分析工具,为房地产投资分析、机器学习模型开发提供了结构化的基准数据,推动了数据驱动的房产投资决策研究。
当前挑战
该数据集致力于解决房地产投资中识别高潜力翻新机会的复杂分类问题,其核心挑战在于如何从高噪声、多变量的市场数据中准确捕捉局部市场的定价异常信号。构建过程中的挑战尤为显著:原始数据存在大量缺失值,如`Zestimate`基准数据不可靠;需要设计稳健的算法,通过邮政编码与卧室数量分层计算局部价格中位数以定义目标变量;同时,必须施加严格的领域知识过滤器以排除不现实的房产条目,并处理地理坐标、价格分布偏斜等多源数据质量问题,确保最终数据集的可靠性与实用性。
常用场景
经典使用场景
在房地产投资分析领域,FlipFinder-USA数据集为识别美国本土的翻新投资机会提供了关键数据支持。该数据集通过精心设计的二元目标变量is_good_flip,将Zillow原始房产列表转化为一个专注于评估房产是否被低估的筛选工具。研究者通常利用该数据集训练机器学习模型,以预测特定房产在本地市场中是否具备价格优势,从而辅助投资决策。其经典应用场景包括构建分类模型,基于价格、面积、卧室数量等特征,自动识别那些价格低于当地中位数15%以上的潜在翻新标的,为量化投资策略提供数据驱动的洞察。
衍生相关工作
围绕FlipFinder-USA数据集的核心思想与方法,已衍生出多项经典研究工作。例如,基于其构建的本地市场相对价格评估框架,后续研究扩展至时间序列分析,用于预测房产价格调整的动态过程。在模型方面,研究者利用该数据集比较了逻辑回归、随机森林与梯度提升树在房产投资分类任务上的性能。另有工作深入探讨了卧室与浴室比例等衍生特征对投资信号的增强作用,并发展了结合地理信息系统(GIS)的空间计量经济学模型,以更精细地刻画邻里效应对房产价值的影响。这些工作共同丰富了数据驱动的房地产投资分析的方法论体系。
数据集最近研究
最新研究方向
在房地产投资分析领域,FlipFinder-USA数据集通过构建二元目标变量is_good_flip,为识别被低估的房产投资机会提供了结构化基准。当前研究前沿聚焦于结合时空分析与机器学习模型,以预测区域市场的价格异常。热点方向包括利用地理空间坐标进行微观市场聚类,探索不同州与邮政编码下的投资回报模式,以及结合房产类型、卧室浴室比例等特征构建可解释的预测系统。这些研究不仅深化了对美国房地产局部市场动态的理解,也为自动化投资筛查工具的开发奠定了数据基础,推动了数据驱动型房产投资策略的实践进展。
以上内容由遇见数据集搜集并总结生成



