
allenai/s2-naip
收藏Hugging Face2026-03-26 更新2024-06-22 收录
下载链接:
https://hf-mirror.com/datasets/allenai/s2-naip
下载链接
链接失效反馈官方服务:
资源简介:
---
license: apache-2.0
---
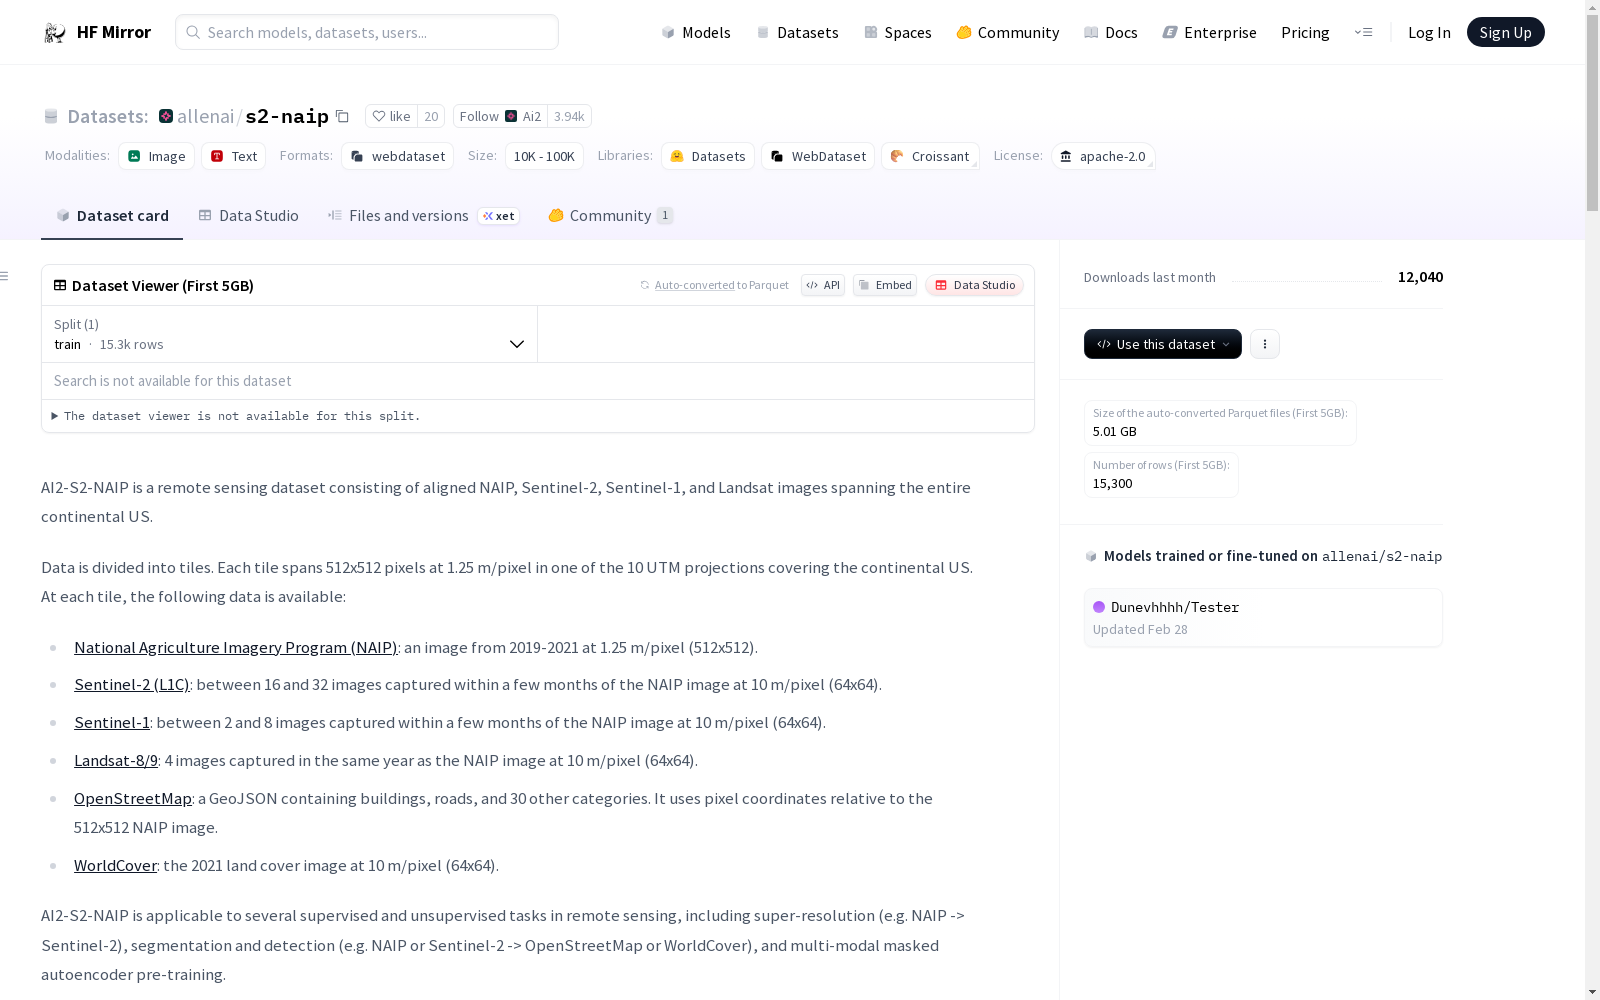
AI2-S2-NAIP is a remote sensing dataset consisting of aligned NAIP, Sentinel-2, Sentinel-1, and Landsat images spanning the entire continental US.
Data is divided into tiles.
Each tile spans 512x512 pixels at 1.25 m/pixel in one of the 10 UTM projections covering the continental US.
At each tile, the following data is available:
- [National Agriculture Imagery Program (NAIP)](https://www.usgs.gov/centers/eros/science/usgs-eros-archive-aerial-photography-national-agriculture-imagery-program-naip): an image from 2019-2021 at 1.25 m/pixel (512x512).
- [Sentinel-2 (L1C)](https://sentinels.copernicus.eu/web/sentinel/missions/sentinel-2): between 16 and 32 images captured within a few months of the NAIP image at 10 m/pixel (64x64).
- [Sentinel-1](https://sentinels.copernicus.eu/web/sentinel/missions/sentinel-1): between 2 and 8 images captured within a few months of the NAIP image at 10 m/pixel (64x64).
- [Landsat-8/9](https://www.usgs.gov/landsat-missions/landsat-8): 4 images captured in the same year as the NAIP image at 10 m/pixel (64x64).
- [OpenStreetMap](https://www.openstreetmap.org): a GeoJSON containing buildings, roads, and 30 other categories. It uses pixel coordinates relative to the 512x512 NAIP image.
- [WorldCover](https://worldcover2021.esa.int/): the 2021 land cover image at 10 m/pixel (64x64).
AI2-S2-NAIP is applicable to several supervised and unsupervised tasks in remote sensing, including super-resolution (e.g. NAIP -> Sentinel-2), segmentation and detection (e.g. NAIP or Sentinel-2 -> OpenStreetMap or WorldCover), and multi-modal masked autoencoder pre-training.
For questions or feedback about AI2-S2-NAIP, please open an issue on Github at https://github.com/allenai/satlas.

Structure
---------
Once extracted, the dataset contains the different data types in different folders.
Each folder contains files named by a tile ID, which consists of the UTM projection, column, and row.
The column and row are based on tiles that are 512x512 pixels with pixel coordinates at 1.25 m/pixel, e.g. `32612_960_-6049.png` spans (614400, -3871360) to (615040, -3870720) in EPSG:32612 projection units.
Here is an example of NAIP data:
```
naip/
32612_960_-6049.png
32612_960_-6050.png
32612_960_-6051.png
...
```
And an example of Sentinel-2 data:
```
sentinel2/
32612_960_-6049_16.tif
32612_960_-6049_32.tif
32612_960_-6049_8.tif
32612_960_-6050_16.tif
...
```
The Sentinel-2, Sentinel-1, and Landsat images are GeoTIFFS so they contain georeference metadata.
Other data does not have georeference metadata, but data at each tile is aligned, so the georeference metadata from the above images is applicable to the other data as well with only a resolution shift.
Mapping Longitude and Latitude to Tile
--------------------------------------
Here is an example of mapping longitude and latitude to a tile.
First install packages:
pip install rasterio shapely utm
Then launch Python shell:
from rasterio.crs import CRS
from rasterio.warp import transform_geom
import shapely
import utm
# Define source location.
src_crs = CRS.from_epsg(4326)
src_point = shapely.Point(-122.331711, 47.648450)
# Get UTM zone.
_, _, zone_suffix, _ = utm.from_latlon(src_point.y, src_point.x)
epsg_code = 32600 + zone_suffix
dst_crs = CRS.from_epsg(epsg_code)
# Transform to UTM CRS.
dst_point = transform_geom(src_crs, dst_crs, src_point)
dst_point = shapely.geometry.shape(dst_point)
# dst_point is in projection coordinates (meters).
# Now convert to pixel coordinates at 1.25 m/pixel.
col = int(dst_point.x/1.25)
row = int(dst_point.y/-1.25)
# Print the prefix for the image filenames.
print(f"{epsg_code}_{col//512}_{row//512}")
# Print the prefix for the tar filenames to know which one to download.
# These group together many 1.25 m/pixel 512x512 tiles into one tar file.
print(f"{epsg_code}_{col//512//32}_{row//512//32}")
So then you would download the tar file from the second prefix, extract it, and look at the file with name matching the first prefix.
See visualize_tile.py for example of visualizing the data at a particular tile.
Sentinel-2
----------
The 10 m/pixel (`_8.tif`), 20 m/pixel (`_16.tif`), and 60 m/pixel (`_32.tif`) bands are stored separately.
Pixel values are the L1C 16-bit values.
The band order is as follows:
- _8.tif (64x64): B02, B03, B04, B08
- _16.tif (32x32): B05, B06, B07, B8A, B11, B12
- _32.tif (16x16): B01, B09, B10
The GeoTIFFs contain multiple images concatenated along the channel axis.
The CSV shows the original Sentinel-2 scene ID of each image.
Sentinel-1
----------
The Sentinel-1 bands are 10 m/pixel and ordered VV then VH.
Only IW VV+VH scenes are used.
The pixel values are 32-bit floating point values representing decibels 10*log10(x).
We obtain the radiometric-calibrated and terrain-corrected images from Google Earth Engine so see
https://developers.google.com/earth-engine/datasets/catalog/COPERNICUS_S1_GRD for details.
The GeoTIFFs contain multiple images concatenated along the channel axis.
The CSV shows the original Sentinel-1 scene ID of each image.
NAIP
----
The NAIP image is 512x512 with four 8-bit bands: R, G, B, IR.
It is encoded as PNG but the IR is alpha mask so cannot be visualized correctly in image viewer without removing the alpha mask.
There are two NAIP images available, one under "naip" (2019-2022) and one under "oldnaip" (2015-2018).
The CSV shows the original NAIP scene ID of each image.
Landsat
-------
We include OLI-TIRS images from Landsat-8 and Landsat-9.
As with Sentinel-2, we select Landsat images that were captured within a few months of the NAIP image.
We store the 15 m/pixel bands (i.e. B8) at 10 m/pixel, and the 30 m/pixel bands (all the others) at 20 m/pixel.
There are separate GeoTIFFs for the 10 m/pixel (`_8.tif`) and 20 m/pixel (`_16.tif`).
All pixel values are 16-bit.
The band order is as follows:
- _8.tif (64x64): B8
- _16.tif (32x32): B1, B2, B3, B4, B5, B6, B7, B9, B10, B11
The GeoTIFFS contain multiple images concatenated along the channel axis.
The CSV shows the original Landsat scene ID of each image.
许可证:Apache-2.0
AI2-S2-NAIP是一套遥感数据集,涵盖覆盖美国本土全范围的对齐式NAIP、Sentinel-2、Sentinel-1与Landsat影像。
该数据集被切分为若干瓦片(tile)。每个瓦片在覆盖美国本土的10个通用横轴墨卡托(Universal Transverse Mercator, UTM)投影下,以1.25米/像素的分辨率覆盖512×512像素范围。每个瓦片包含以下数据:
- 美国国家农业影像计划(National Agriculture Imagery Program, NAIP):2019-2021年采集的1.25米/像素分辨率影像(尺寸512×512),来源:https://www.usgs.gov/centers/eros/science/usgs-eros-archive-aerial-photography-national-agriculture-imagery-program-naip
- Sentinel-2(L1C):在NAIP影像采集前后数月内获取的16至32幅10米/像素分辨率影像(尺寸64×64),来源:https://sentinels.copernicus.eu/web/sentinel/missions/sentinel-2
- Sentinel-1:在NAIP影像采集前后数月内获取的2至8幅10米/像素分辨率影像(尺寸64×64),来源:https://sentinels.copernicus.eu/web/sentinel/missions/sentinel-1
- Landsat-8/9:与NAIP影像同年度采集的4幅10米/像素分辨率影像(尺寸64×64),来源:https://www.usgs.gov/landsat-missions/landsat-8
- 开放街道地图(OpenStreetMap):包含建筑物、道路及其他30类地物的GeoJSON文件,采用相对于512×512的NAIP影像的像素坐标系统,来源:https://www.openstreetmap.org
- WorldCover:2021年土地覆盖影像,分辨率10米/像素(尺寸64×64),来源:https://worldcover2021.esa.int/
AI2-S2-NAIP可用于遥感领域的多项有监督与无监督任务,包括超分辨率重建(例如NAIP → Sentinel-2)、地物分割与目标检测(例如NAIP或Sentinel-2 → 开放街道地图或WorldCover),以及多模态掩码自编码器预训练。
如有关于AI2-S2-NAIP的疑问或反馈,请在GitHub仓库https://github.com/allenai/satlas 提交Issue。

---------
数据集结构
---------
解压后,数据集将不同数据类型存储在独立文件夹中。每个文件夹内的文件以瓦片ID命名,瓦片ID由UTM投影带号、列号与行号组成。列号与行号基于分辨率为1.25米/像素的512×512像素瓦片,例如`32612_960_-6049.png`在EPSG:32612投影坐标系下覆盖的坐标范围为(614400, -3871360) 至 (615040, -3870720)。
以下为NAIP数据的目录示例:
naip/
32612_960_-6049.png
32612_960_-6050.png
32612_960_-6051.png
...
以下为Sentinel-2数据的目录示例:
sentinel2/
32612_960_-6049_16.tif
32612_960_-6049_32.tif
32612_960_-6049_8.tif
32612_960_-6050_16.tif
...
Sentinel-2、Sentinel-1与Landsat影像均为GeoTIFF格式,包含地理参考元数据。其余数据无地理参考元数据,但各瓦片内的数据均已严格对齐,因此仅需通过分辨率缩放即可复用上述影像的地理参考元数据。
---------
经纬度转瓦片映射
---------
以下为经纬度转换为瓦片ID的示例流程:
1. 安装依赖包:
pip install rasterio shapely utm
2. 启动Python交互环境:
python
from rasterio.crs import CRS
from rasterio.warp import transform_geom
import shapely
import utm
# 定义源坐标点
src_crs = CRS.from_epsg(4326)
src_point = shapely.Point(-122.331711, 47.648450)
# 获取UTM投影带号
_, _, zone_suffix, _ = utm.from_latlon(src_point.y, src_point.x)
epsg_code = 32600 + zone_suffix
dst_crs = CRS.from_epsg(epsg_code)
# 将坐标转换至UTM坐标系
dst_point = transform_geom(src_crs, dst_crs, src_point)
dst_point = shapely.geometry.shape(dst_point)
# dst_point 单位为投影坐标系米级坐标
# 转换为1.25米/像素分辨率下的像素坐标
col = int(dst_point.x/1.25)
row = int(dst_point.y/-1.25)
# 输出影像文件名前缀
print(f"{epsg_code}_{col//512}_{row//512}")
# 输出tar包文件名前缀,用于确定需下载的文件
# 该tar包包含多个1.25米/像素的512×512瓦片
print(f"{epsg_code}_{col//512//32}_{row//512//32}")
随后你可根据第二个前缀下载对应的tar文件,解压后查找与第一个前缀匹配的影像文件。可参考`visualize_tile.py`查看特定瓦片数据的可视化示例。
---------
Sentinel-2 细节
---------
10米/像素(`_8.tif`)、20米/像素(`_16.tif`)与60米/像素(`_32.tif`)的波段分别独立存储。像素值为Sentinel-2 L1C产品的16位原始数值。
波段顺序如下:
- `_8.tif`(64×64):B02、B03、B04、B08
- `_16.tif`(32×32):B05、B06、B07、B8A、B11、B12
- `_32.tif`(16×16):B01、B09、B10
GeoTIFF文件沿通道轴拼接了多幅影像,配套CSV文件会列出每幅影像的原始Sentinel-2场景ID。
---------
Sentinel-1 细节
---------
Sentinel-1波段分辨率为10米/像素,波段顺序为VV极化后接VH极化。仅使用IW模式的VV+VH极化场景。
像素值为32位浮点数,代表分贝值(计算公式为10*log10(x))。我们从谷歌地球引擎获取了经过辐射定标与地形校正的影像,详细信息请参考:https://developers.google.com/earth-engine/datasets/catalog/COPERNICUS_S1_GRD。
GeoTIFF文件沿通道轴拼接了多幅影像,配套CSV文件会列出每幅影像的原始Sentinel-1场景ID。
---------
NAIP 细节
-----
NAIP影像尺寸为512×512,包含4个8位波段:红(R)、绿(G)、蓝(B)、近红外(IR)。该影像以PNG格式编码,但近红外波段被存储为alpha通道,因此若要在常规图像查看器中正确可视化,需先移除alpha通道。
目前提供两类NAIP影像:`naip`目录下的2019-2022年采集数据,以及`oldnaip`目录下的2015-2018年采集数据。配套CSV文件会列出每幅影像的原始NAIP场景ID。
---------
Landsat 细节
-------
我们包含了Landsat-8与Landsat-9的OLI-TIRS影像。与Sentinel-2一致,我们选取了与NAIP影像采集时间相隔数月内的Landsat影像。
我们将15米/像素分辨率的波段(即B8)重采样至10米/像素,其余30米/像素分辨率的波段重采样至20米/像素分辨率。分别为10米/像素(`_8.tif`)与20米/像素(`_16.tif`)存储独立的GeoTIFF文件。所有像素值均为16位整数。
波段顺序如下:
- `_8.tif`(64×64):B8
- `_16.tif`(32×32):B1、B2、B3、B4、B5、B6、B7、B9、B10、B11
GeoTIFF文件沿通道轴拼接了多幅影像,配套CSV文件会列出每幅影像的原始Landsat场景ID。
提供机构:
allenai
原始信息汇总
AI2-S2-NAIP 数据集概述
数据集简介
AI2-S2-NAIP 是一个遥感数据集,包含覆盖整个美国大陆的对齐的 NAIP、Sentinel-2、Sentinel-1 和 Landsat 图像。
数据结构
数据被划分为多个瓦片,每个瓦片为 512x512 像素,分辨率为 1.25 米/像素,位于美国大陆的 10 个 UTM 投影之一。
每个瓦片包含的数据类型:
- National Agriculture Imagery Program (NAIP): 2019-2021 年的图像,分辨率为 1.25 米/像素(512x512)。
- Sentinel-2 (L1C): 在 NAIP 图像拍摄后几个月内捕获的 16 到 32 张图像,分辨率为 10 米/像素(64x64)。
- Sentinel-1: 在 NAIP 图像拍摄后几个月内捕获的 2 到 8 张图像,分辨率为 10 米/像素(64x64)。
- Landsat-8/9: 在 NAIP 图像拍摄同年捕获的 4 张图像,分辨率为 10 米/像素(64x64)。
- OpenStreetMap: 包含建筑物、道路和 30 个其他类别的 GeoJSON,使用相对于 512x512 NAIP 图像的像素坐标。
- WorldCover: 2021 年的土地覆盖图像,分辨率为 10 米/像素(64x64)。
数据集应用
AI2-S2-NAIP 适用于遥感领域的多种监督和非监督任务,包括超分辨率(例如 NAIP -> Sentinel-2)、分割和检测(例如 NAIP 或 Sentinel-2 -> OpenStreetMap 或 WorldCover)以及多模态掩码自编码器预训练。
数据文件结构
数据集提取后,不同类型的数据存储在不同的文件夹中。每个文件夹中的文件按瓦片 ID 命名,瓦片 ID 由 UTM 投影、列和行组成。
示例
-
NAIP 数据:
naip/ 32612_960_-6049.png 32612_960_-6050.png 32612_960_-6051.png ...
-
Sentinel-2 数据:
sentinel2/ 32612_960_-6049_16.tif 32612_960_-6049_32.tif 32612_960_-6049_8.tif 32612_960_-6050_16.tif ...
图像细节
- Sentinel-2: 分辨率为 10 米/像素(
_8.tif)、20 米/像素(_16.tif)和 60 米/像素(_32.tif)的波段分别存储。像素值为 L1C 16 位值。 - Sentinel-1: 分辨率为 10 米/像素,波段顺序为 VV 然后 VH。像素值为 32 位浮点数,表示 10*log10(x) 的 dB 值。
- NAIP: 图像为 512x512,包含四个 8 位波段:R、G、B、IR。IR 作为 alpha 掩码,需要去除才能正确可视化。
- Landsat: 包含 Landsat-8 和 Landsat-9 的 OLI-TIRS 图像。分辨率为 10 米/像素(
_8.tif)和 20 米/像素(_16.tif)的波段分别存储。像素值为 16 位。
搜集汇总
数据集介绍
构建方式
AI2-S2-NAIP遥感数据集的构建,涵盖了美国大陆范围内的NAIP、Sentinel-2、Sentinel-1及Landsat影像数据的精确对齐。数据集以512x512像素的瓦片形式组织,每个瓦片包含2019-2021年间采集的NAIP影像,以及与NAIP影像时间相近的Sentinel-2、Sentinel-1和Landsat影像,还包括OpenStreetMap地理信息系统数据及WorldCover土地覆盖数据,实现了多源数据的融合与整合。
使用方法
使用AI2-S2-NAIP数据集,用户首先需要根据具体的研究区域确定对应的瓦片,通过坐标转换工具将经纬度坐标映射到瓦片编号。然后下载相应的数据包并解压,获取包含不同数据类型的文件夹。由于Sentinel-2、Sentinel-1和Landsat影像包含地理参考信息,用户可以借助GIS软件或编程库进行数据的读取、分析和可视化。
背景与挑战
背景概述
AI2-S2-NAIP数据集,由Allen Institute for Artificial Intelligence(AI2)构建,是一个包含全美大陆范围内对齐的NAIP、Sentinel-2、Sentinel-1和Landsat遥感图像的数据集。该数据集的创建旨在推进遥感领域的研究,特别是在图像超分辨率、图像分割与检测、以及多模态自编码器预训练等方面。数据集涵盖了2019-2021年的NAIP图像,以及在同一时期内捕获的Sentinel-2、Sentinel-1和Landsat图像,为研究人员提供了丰富的时空数据资源。AI2-S2-NAIP的构建,不仅展现了AI2在遥感数据处理方面的技术实力,也为相关领域的研究提供了强有力的数据支撑,对推动遥感图像分析技术的发展具有显著影响。
当前挑战
尽管AI2-S2-NAIP数据集为遥感领域的研究提供了宝贵资源,但在使用过程中仍面临诸多挑战。首先,数据集的构建过程中涉及到大量图像的对齐与融合,这对图像处理算法提出了较高要求。其次,遥感图像的分析与解读需要专业知识,普通用户可能难以直接从中提取有效信息。此外,数据集的规模巨大,对计算资源的需求较高,这限制了部分研究者的使用。最后,如何充分利用多源遥感数据,实现更精准的信息提取和更高效的模型训练,是该领域面临的重要挑战之一。
常用场景
经典使用场景
在遥感领域,AllenAI的S2-NAIP数据集以其综合性的地理信息资源,被广泛用于监督学习和无监督学习任务。其经典使用场景包括超分辨率任务,如图像从NAIP到Sentinel-2的转换;以及分割和检测任务,如从NAIP或Sentinel-2到OpenStreetMap或WorldCover的映射。这些应用场景有效地促进了遥感图像的精确解析和地物信息的细致提取。
解决学术问题
该数据集解决了遥感研究中图像分辨率不匹配、多源数据融合困难等问题。它通过提供不同分辨率和时间跨度的卫星图像以及地理信息系统数据,为研究者提供了丰富的信息资源,有助于提高遥感图像分析的准确性和效率。这对于农业监测、城市规划、环境变化评估等学术研究具有重大意义。
实际应用
在现实应用中,S2-NAIP数据集可用于精确农业、城市规划、灾害监测和环境保护等多个领域。例如,通过分析不同时间点的土地覆盖变化,研究人员可以监测城市扩张或农业用地变化,为政策制定提供科学依据。此外,在灾害响应中,该数据集能够辅助评估灾害影响范围,优化救援资源的分配。
数据集最近研究
最新研究方向
在遥感领域,AI2-S2-NAIP数据集因其整合了多源卫星图像和地理信息,成为了研究的热点。该数据集支持多种监督和非监督学习任务,如超分辨率、图像分割与检测等。近期研究方向主要聚焦于利用该数据集进行多模态学习的预训练,以及通过深度学习技术提高卫星图像解析的精度和效率,这对于地理信息系统、环境监测和农业等领域的发展具有重要的实践意义和广泛的应用前景。
以上内容由遇见数据集搜集并总结生成



