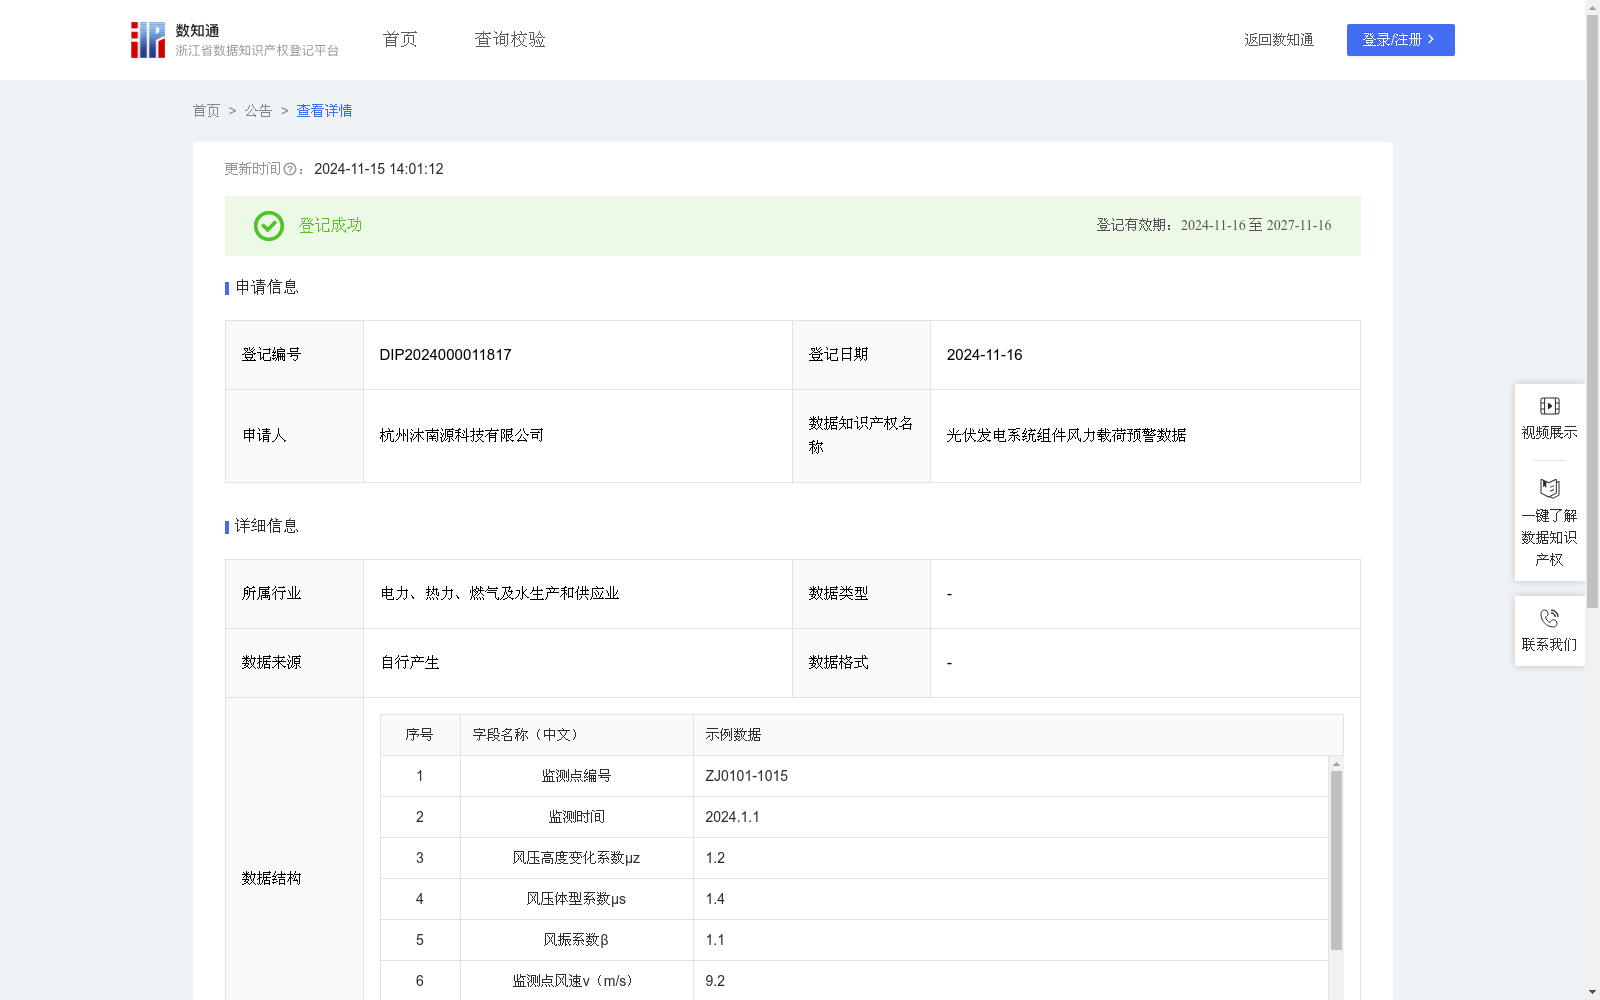
光伏发电系统组件风力载荷预警数据
收藏浙江省数据知识产权登记平台2024-11-15 更新2024-11-16 收录
下载链接:
https://www.zjip.org.cn/home/announce/trends/85252
下载链接
链接失效反馈官方服务:
资源简介:
数据来源于对光伏发电系统组件的风力荷载检测.通过使用风力荷载检测数据,来保证光伏组件的平稳安全运行,避免因荷载超负荷导致的事故,确保光伏发电组件的使用寿命和结构安全,为系统优化和施工提供重要依据。1数据采集:通过风速监测点,可以得到此时的风速情况。2数据计算:根据流体运动的伯努利方程原理可以得出的风速和风压的关系,风压为:ω0=0.5*r0* v^2,其中ω0为风压,r0为空气密度,空气密度为1.28kg/m3 固定值,v为风速;通过搜集获得的风压ω0数据,可以进一步计算得出此时的光伏发电系统受到的风载荷数值为:Wk=μz*μs*β*ω0,风载荷达到光伏发电组件载荷设计值的80%则发送二级预警信号,达到设计标准的90%则发送一级预警信号,否则预警情况为否,由此我们可以评估此时光伏发电系统的运行安全情况,减少事故情况的发生。
This dataset is sourced from wind load testing of photovoltaic (PV) system components. Utilizing the wind load test data can ensure the stable and safe operation of PV modules, prevent accidents caused by load overload, secure the service life and structural safety of photovoltaic modules, and provide critical support for system optimization and construction works.
1. Data Collection: Wind speed conditions at the time of testing can be obtained via wind speed monitoring points.
2. Data Calculation: The correlation between wind speed and wind pressure can be derived based on the principle of Bernoulli's equation for fluid motion, with the wind pressure calculated as: ω₀ = 0.5 * r₀ * v², where ω₀ denotes wind pressure, r₀ is the air density fixed at 1.28 kg/m³, and v represents the measured wind speed. Using the collected wind pressure data ω₀, the wind load value acting on the photovoltaic system at this moment can be further calculated as: Wₖ = μ_z * μ_s * β * ω₀. If the wind load reaches 80% of the design load value of the PV modules, a secondary warning signal will be triggered; if it reaches 90% of the design standard, a primary warning signal will be sent; otherwise, no warning will be issued. Accordingly, we can assess the operational safety status of the photovoltaic system and reduce the incidence of accidents.
提供机构:
杭州沐南源科技有限公司
创建时间:
2024-10-17
搜集汇总
数据集介绍
特点
该数据集包含光伏发电系统组件的风力荷载检测数据,用于评估系统运行安全情况,避免因荷载超负荷导致的事故。数据每日更新,规模为7028条,涵盖风速、风压及风载荷等关键参数,并设有预警机制以确保组件安全。
以上内容由遇见数据集搜集并总结生成


