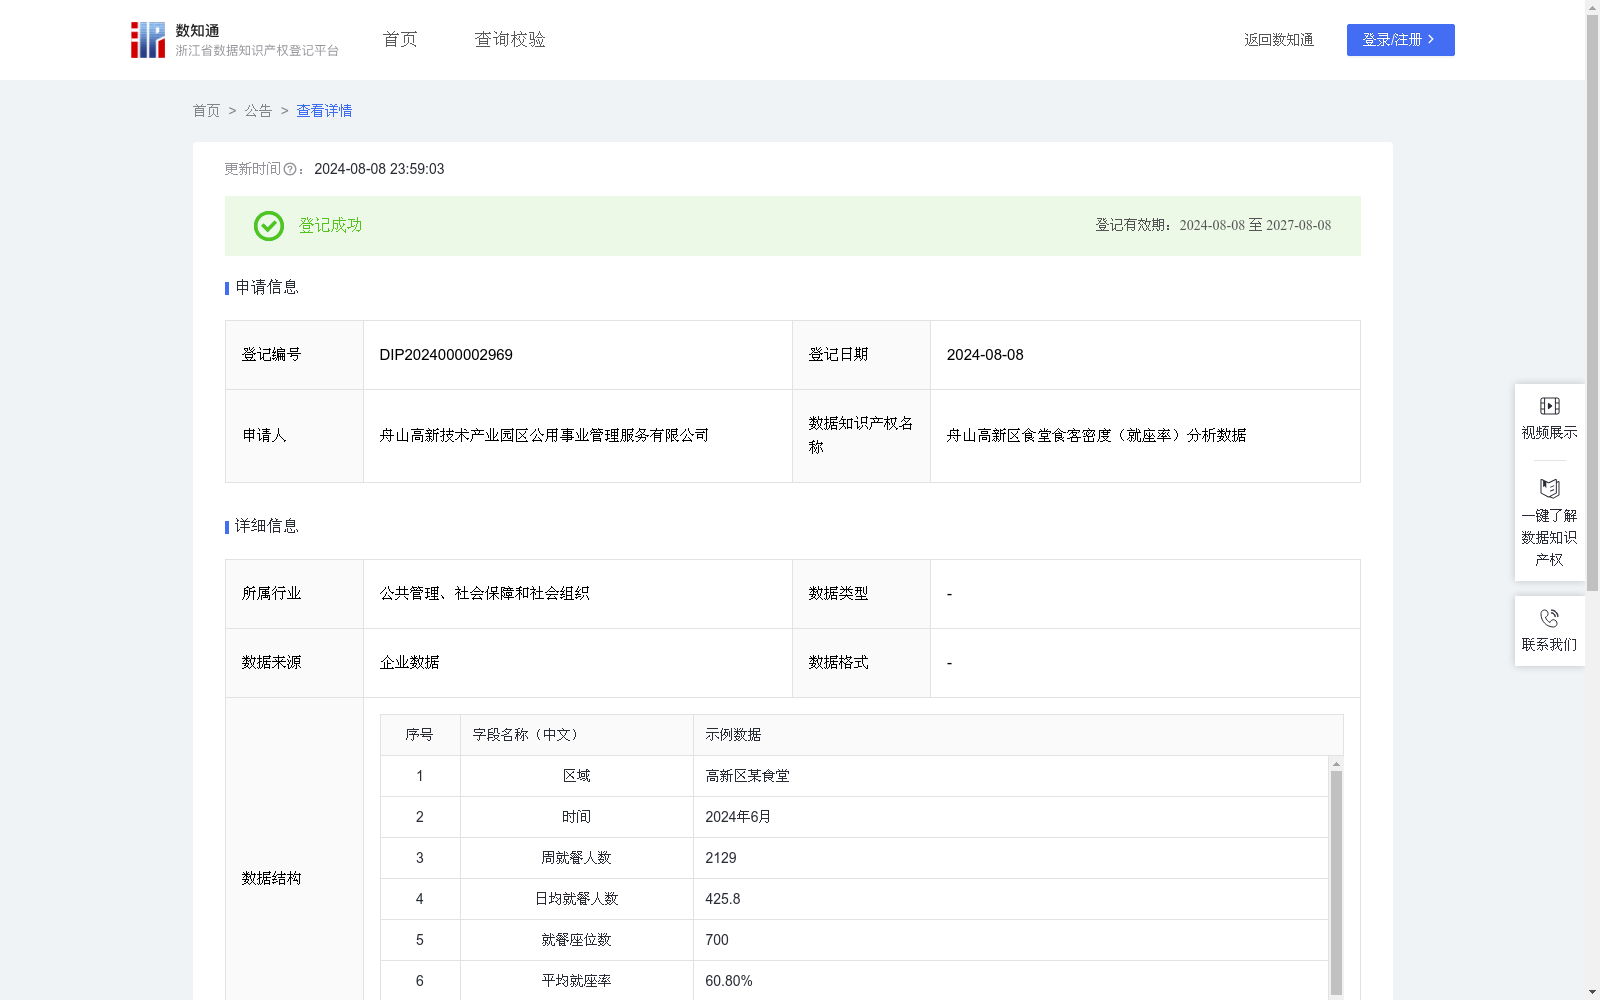
舟山高新区食堂食客密度(就座率)分析数据
收藏浙江省数据知识产权登记平台2024-08-08 更新2024-08-09 收录
下载链接:
https://www.zjip.org.cn/home/announce/trends/48689
下载链接
链接失效反馈官方服务:
资源简介:
食堂食客密度(就座率)数据是衡量食堂运营效率和拥挤程度的重要指标,过高或者过低的食堂食客密度(就座率)均不利于提高食堂服务质量,通过分析食堂食客密度(就座率)分析数据,能够辅助判断是否需要增加座位或减少座位,以提高食客满意度,并为后续运营决策和新食堂建设优化提供数据支撑。
1.数据采集:利用就餐服务卡管理系统,采集每日食堂就餐人数等数据。2.数据计算处理:以时间为基准,按周为单位对食堂的就餐人数等进行汇总,日均就餐人数=周就餐人数/5(按平均一周五个工作日计算),平均就座率=日均就餐人数/额定就餐人数*100%。并开展平均就座率运营效率分析,将食堂的平均就座率在40%以下的为运营效率低,食堂的平均就座率在40%-50%的为运营效率较低,50%-60%的为运营效率一般,60%-70%的为运营效率较高,70%以上的为运营效率高,但平均就座率在90%以上的需要设置为就餐预警,需要及时新增就餐座位或者开展就餐分流。通过使用3D统计图可以直观地查看指定日期的食堂就餐人数的就餐人数及就座率情况,以增强数据的可读性。
Canteen patron density (seating occupancy rate) data is a critical indicator for measuring canteen operational efficiency and crowd level. Both excessively high and excessively low canteen patron density (seating occupancy rate) are detrimental to improving canteen service quality. Analyzing such data can assist in determining whether to add or reduce seats, thereby enhancing patron satisfaction, and providing data support for subsequent operational decisions and optimization of new canteen construction.
1. Data Collection: Data such as daily canteen patron counts are collected using the dining service card management system.
2. Data Calculation and Processing: Data including canteen patron counts are aggregated on a weekly time basis. The average daily patron count is calculated as total weekly patron counts divided by 5 (calculated based on an average of 5 working days per week). The average seating occupancy rate is calculated as (average daily patron count / rated seating capacity) * 100%.
Operational efficiency analysis based on average seating occupancy rate is then conducted: canteens with an average occupancy rate below 40% are categorized as having low operational efficiency; those with 40%-50% as relatively low efficiency; 50%-60% as moderate efficiency; 60%-70% as relatively high efficiency; and above 70% as high operational efficiency. However, when the average occupancy rate exceeds 90%, a dining early warning should be triggered, requiring timely addition of dining seats or implementation of dining flow diversion.
3D statistical charts can be used to intuitively view the canteen patron count and seating occupancy rate on designated dates, thereby enhancing data readability.
提供机构:
舟山高新技术产业园区公用事业管理服务有限公司
创建时间:
2024-07-09
搜集汇总
数据集介绍
特点
该数据集包含舟山高新区食堂的食客密度(就座率)数据,用于分析食堂运营效率和拥挤程度,辅助决策座位调整。数据规模为601条,每年更新一次。
以上内容由遇见数据集搜集并总结生成


