全球GPP/NPP/NEE数据产品
收藏地球大数据科学工程2024-03-04 收录
下载链接:
https://data.casearth.cn/sdo/detail/6538a184819aec0f2611d12a
下载链接
链接失效反馈官方服务:
资源简介:
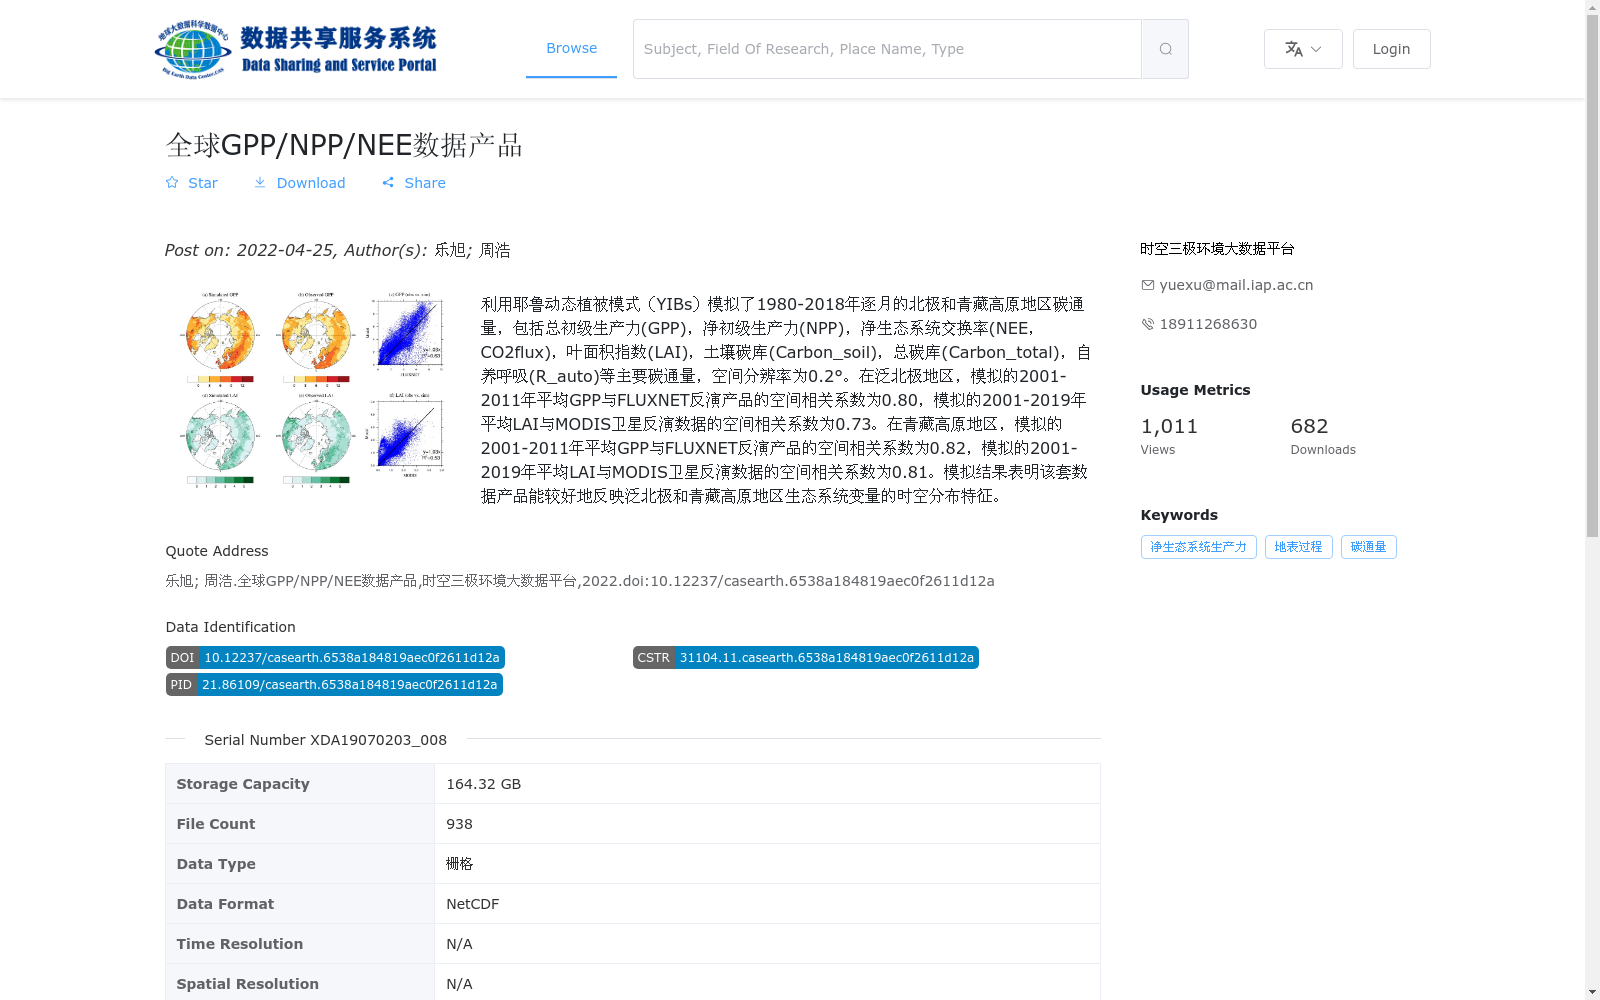
利用耶鲁动态植被模式(YIBs)模拟了1980-2018年逐月的北极和青藏高原地区碳通量,包括总初级生产力(GPP),净初级生产力(NPP),净生态系统交换率(NEE,CO2flux),叶面积指数(LAI),土壤碳库(Carbon_soil),总碳库(Carbon_total),自养呼吸(R_auto)等主要碳通量,空间分辨率为0.2°。在泛北极地区,模拟的2001-2011年平均GPP与FLUXNET反演产品的空间相关系数为0.80,模拟的2001-2019年平均LAI与MODIS卫星反演数据的空间相关系数为0.73。在青藏高原地区,模拟的2001-2011年平均GPP与FLUXNET反演产品的空间相关系数为0.82,模拟的2001-2019年平均LAI与MODIS卫星反演数据的空间相关系数为0.81。模拟结果表明该套数据产品能较好地反映泛北极和青藏高原地区生态系统变量的时空分布特征。
Using the Yale Interactive Biosphere Model (YIBs), monthly carbon fluxes over the Arctic and Tibetan Plateau regions from 1980 to 2018 were simulated. The dataset includes key carbon flux and ecosystem variables such as Gross Primary Productivity (GPP), Net Primary Productivity (NPP), Net Ecosystem Exchange (NEE, CO₂ flux), Leaf Area Index (LAI), soil carbon pool (Carbon_soil), total carbon pool (Carbon_total), and autotrophic respiration (R_auto), with a spatial resolution of 0.2°. Over the pan-Arctic region, the spatial correlation coefficient between the simulated mean GPP during 2001–2011 and the FLUXNET inversion product reached 0.80, while that between the simulated mean LAI during 2001–2019 and the MODIS satellite inversion data was 0.73. Over the Tibetan Plateau region, the spatial correlation coefficient between the simulated mean GPP during 2001–2011 and the FLUXNET inversion product was 0.82, while that between the simulated mean LAI during 2001–2019 and the MODIS satellite inversion data reached 0.81. Simulation results demonstrate that this dataset can well capture the spatiotemporal distribution characteristics of ecosystem variables over the pan-Arctic and Tibetan Plateau regions.
提供机构:
时空三极环境大数据平台
搜集汇总
数据集介绍
背景与挑战
背景概述
该数据集利用耶鲁动态植被模式(YIBs)模拟了1980-2018年逐月的北极和青藏高原地区碳通量,包括GPP、NPP、NEE等关键变量,空间分辨率为0.2°。模拟结果与FLUXNET和MODIS数据具有较高的空间相关性(相关系数0.73-0.82),验证了数据能较好地反映这两个地区生态系统变量的时空分布特征,适用于碳循环和气候变化研究。
以上内容由遇见数据集搜集并总结生成


