Dataset for Gillerot et al. (2024) "Urban tree canopies drive human heat stress mitigation" in <i>Urban Forestry & Urban Greening</i>
收藏资源简介:
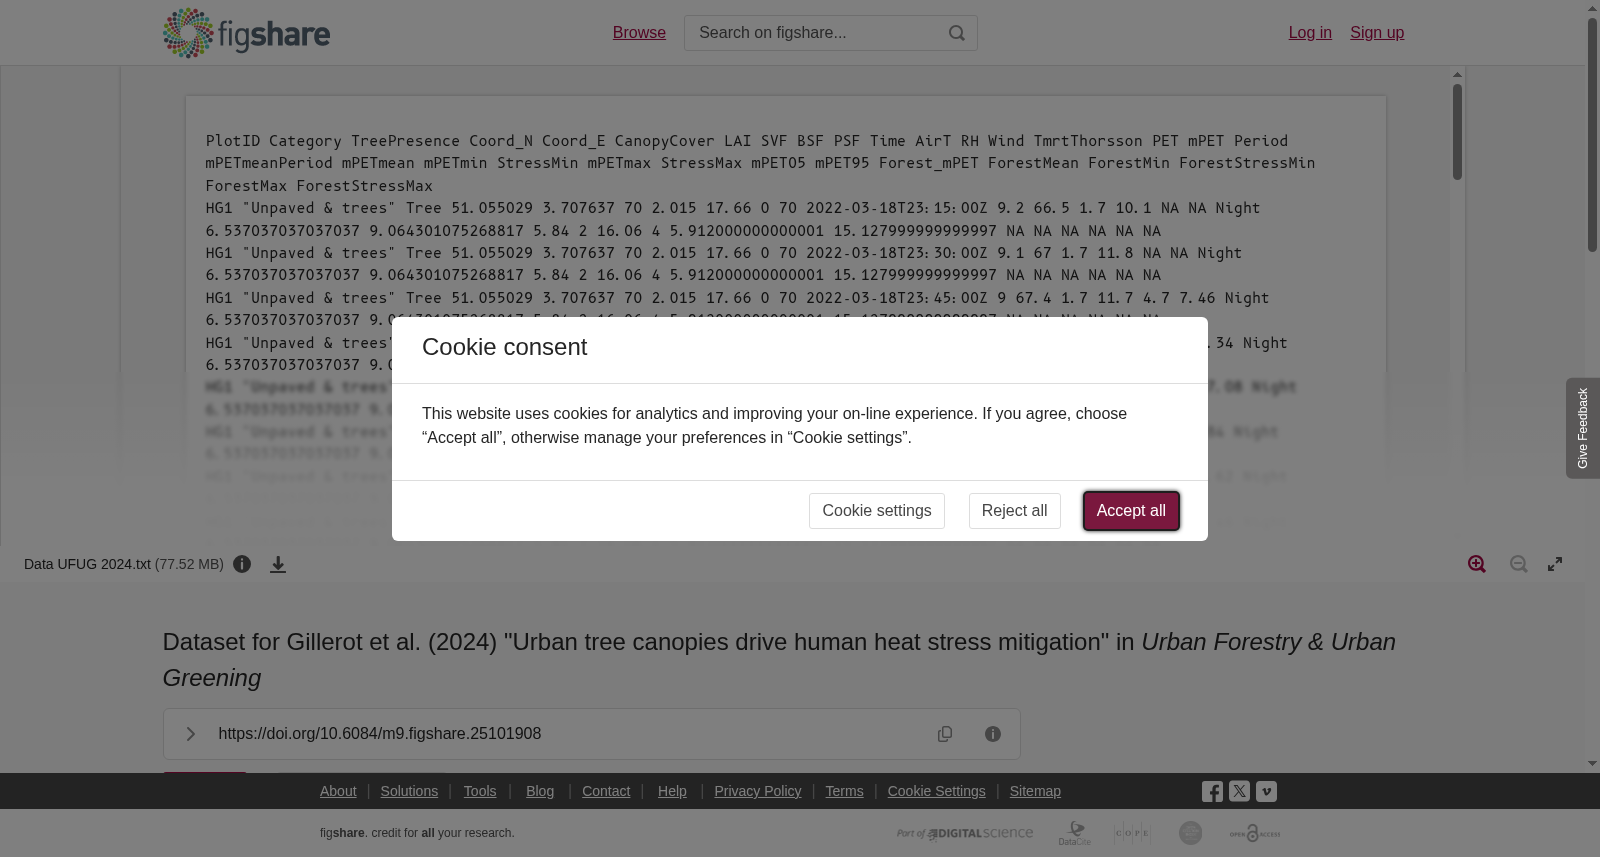
This dataset was used for the paper: "Urban tree canopies drive human heat stress mitigation" published in 2024 in <i>Urban Forestry & Urban Greening </i>(https://doi.org/10.1016/j.ufug.2023.128192). Full methodological details are found in the paper. Here follows the column description:<b>PlotID</b><b> </b>= Plot code.<b>Category </b>= One of four land-use categories as defined in the paper and its Table 1.<b>TreePresence </b>= Binary variable denoting whether a tree was present within the circular plot with radius 10m around the sensors.<b>Coord_N, Coord_E </b>= Coordinates, decimal format.<b>CanopyCover</b><b> </b>= Percentage of plot covered with tree canopies, based on visual estimation of the vertically projected canopies sensu Zellweger et al. (2019).<b>LAI</b> = Leaf Area Index, based on hemispherical pictures.<b>SVF</b> = Sky View Factor, based on hemispherical pictures.<b>BSF</b> = Building View Factor, based on hemispherical pictures.<b>PSF</b> = Pervious Surface Fraction.<b>Time</b> = Timestamp at a 15-min resolution.<b>AirT</b> = Air temperature in °C.<b>RH </b>= Relative Humidity in %.<b>Wind</b> = Wind speed in m/s. <b>TmrtThorsson</b> = Mean Radiant Temperature, calculated following Thorsson et al. (2007).<b>PET</b> = Physiologically Equivalent Temperature, calculated in Rayman (Matzarakis et al. 2007, 2010).<b>mPET</b> = modified PET, sensu Chen & Matzarakis (2018). <b>Period</b> = Period of day (night, morning, afternoon or evening).<b>mPETmeanPeriod </b> = Mean mPET within the given period. <b>mPETmean</b> = Mean mPET during the whole day.<b>mPETmin/max </b> = Daily minimum or maximum mPET.<b>StressMin/Max </b> = Heat stress category following Matzarakis et al. (1999) based on daily minimum or maximum mPET.<b>mPET05/95</b> = Daily 5th and 95th percentiles of mPET, as an alternative measure for daily minimum and maximum mPET that is slightly less sensitive to outliers.<b>Forest_mPET/Mean/Min/Max/StressMin/StressMax</b> = Analogous values for rural forest control conditions. Based on mean values of 10 mature forests located under Ghent. <b>TC_clo_head</b><b> </b>to<b> </b><b>TC_clo_foot</b> = The clothing and fabric participants were wearing (self-reported).<b>QuestionnaireTime</b> = Time when participants filled in the questionnaire related to thermal comfort.<b>AirT</b> = Air temperature at the time of filling in the thermal comfort questionnaire.<b>TmrtThorsson</b> = Mean radiant temperature, following calculations as in Thorsson et al. (2007), at the time of filling in the thermal comfort questionnaire.<b>PET</b><b> </b>= Physiologically Equivalent Temperature at the time of filling in the thermal comfort questionnaire.<b>mPET</b><b> </b>= Modified Physiologically Equivalent Temperature at the time of filling in the thermal comfort questionnaire.<b>PETroll</b><b> </b>= Physiologically Equivalent Temperature at the time of filling in the thermal comfort questionnaire, with a 10-min left-aligned rolling average to correct for the thermal conditions experienced in the period before the questionnaire was filled in.<b>mPETroll</b><b> </b>= Modified Physiologically Equivalent Temperature at the time of filling in the thermal comfort questionnaire, with a 10-min left-aligned rolling average to correct for the thermal conditions experienced in the period before the questionnaire was filled in.<b>BAplot</b>= Basal area of forest plots only.<b>ShannonBAScaled</b> = Shannon diversity based on the species-specific proportions in terms of basal area within the plot. Only for forests.<b>ShannonCovScaled</b> = Shannon diversity based on the species-specific proportions in terms of crown cover within the plot. Only for forests.<b>Hplot</b> = Average height of the dominant trees. Only for forests.<b>CCperc</b> = Canopy cover of the plot, in percent, based on hemispherical photographs. Forest forests, but also for non-forest conditions. The latter corresponds then to the share of obscured sky.<b>AI_total</b> = Authenticity index.