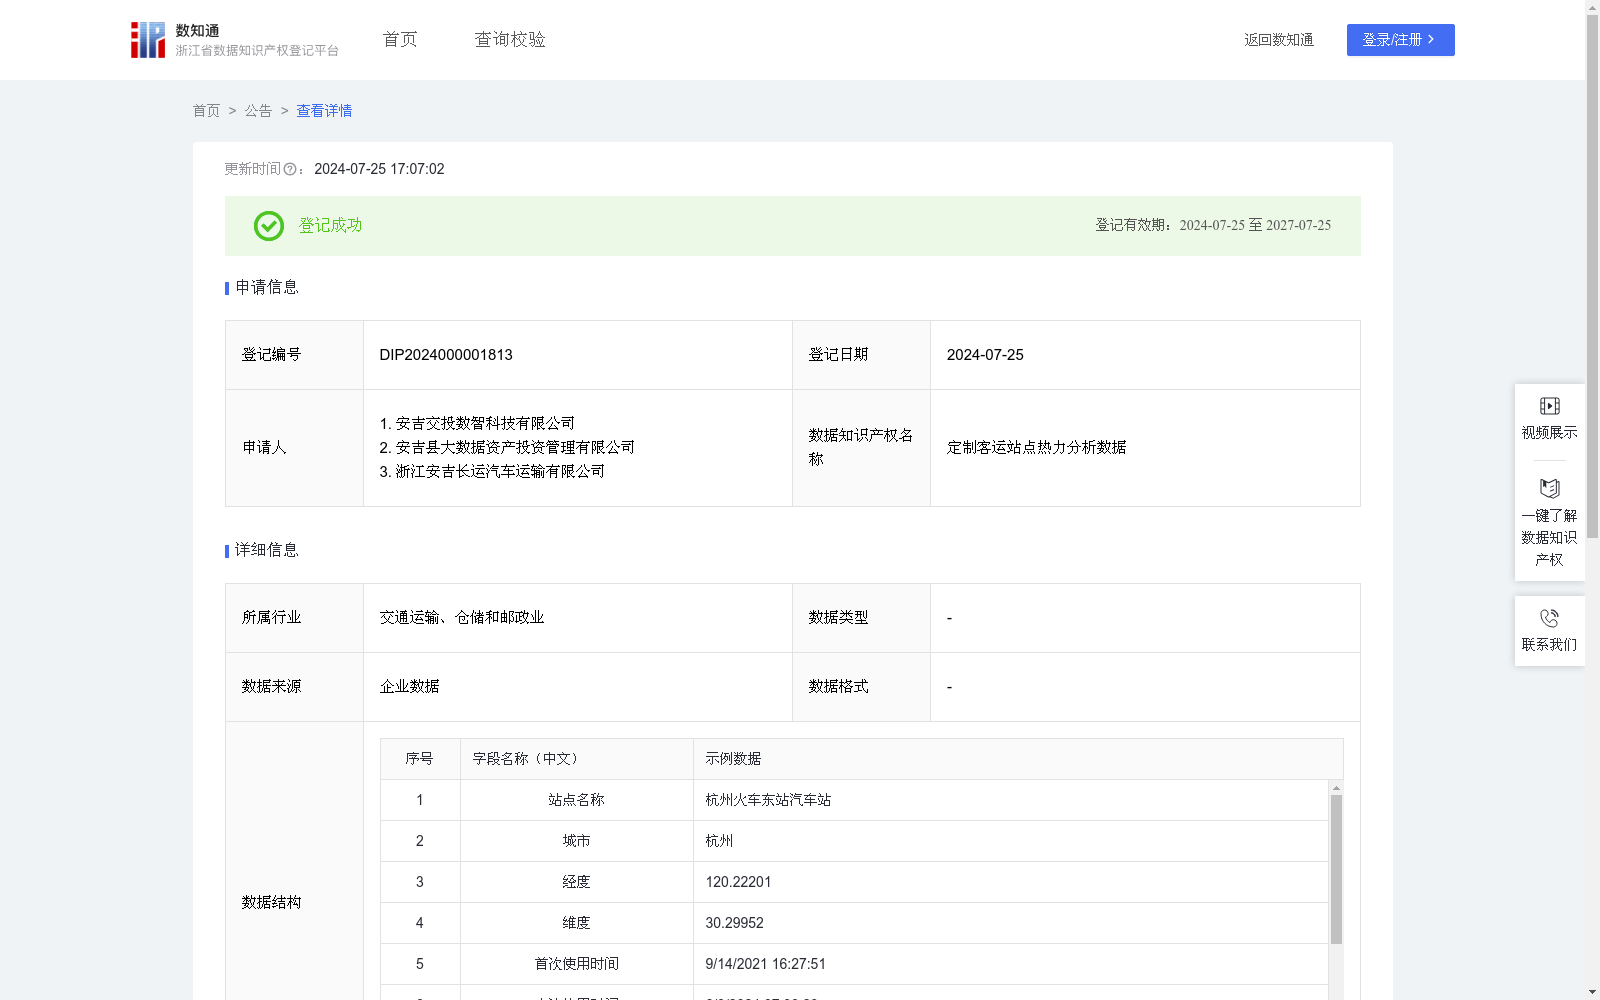
定制客运站点热力分析数据
收藏资源简介:
定制客运站点优化与规划:根据站点使用次数和热门指数,优化站点布局,增加或减少某些站点的服务频率。识别高需求区域,为新站点的设置提供数据支持。市场分析:分析不同城市的客运需求,了解哪些区域更受欢迎,为市场扩展提供依据。通过时间指数和热门指数,了解乘客的出行模式和偏好。定价策略:根据站点的累计金额和使用次数,制定差异化的定价策略,如高峰时段的定价调整。营销活动:利用热门标签和热门指数,针对高流量站点进行定向营销和推广活动。在低流量站点提供优惠或促销活动,以吸引更多乘客。运营管理:根据站点的使用时间间隔和末次使用时间,优化车辆调度和司机排班。预测高峰时段,提前准备资源以应对需求高峰。客户服务:通过分析乘客的出行数据,提供个性化的服务推荐,如根据乘客的出行习惯推荐最佳出行时间和路线。步骤 1:收集定制客运订单信息:订单编号,订单创建时间,出发城市,出发站点,出发站点经度,出发站点维度,订单金额等。定义站点使用时间间隔=时间间隔是站点从首次使用减末次使用的时间跨度(天数); 步骤 2: 标准化数据:对站点使用次数和合计金额进行标准化处理,以消除不同量纲的影响。 同站点的数据进行分类聚汇总,并根据订单创建时间,计算出本站点的首次下单时间,及末次下单时间; 步骤 3: 应用权重并计算热门指数:结合站点使用时间间隔,计算时间指数=1/站点使用时间间隔*100;计算热门指数的计算公式,以反映站点的使用频率和持续性,并为每个指标分配权重;站点使用次数权重:0.5;累计金额权重:0.3;时间指数权重:0.2;计算热门指数:【(站点使用次数*权重0.5)+(累计金额*权重0.3)+(时间指数*权重0.2)】/1000,以此计算每个站点的热门指数; 步骤 4: 设定阈值并标记热门标签:根据热门指数的分布,设定阈值分为五个不同等级的热门站点:高度热门:指数大于100;中高度热门:指数大于25;中度热门:指数大于8;中低热门:指数大于2;低度热门:指数小于2
Customized Passenger Station Optimization and Planning: Optimize station layout and adjust service frequencies of certain stations by increasing or decreasing them based on station usage times and popularity indexes. Identify high-demand areas to provide data support for the establishment of new stations. Market Analysis: Analyze passenger demands across different cities, identify more popular regions, and provide a basis for market expansion. Understand travel patterns and preferences of passengers through time indexes and popularity indexes. Pricing Strategy: Develop differentiated pricing strategies based on the cumulative amount and usage times of stations, such as pricing adjustments during peak hours. Marketing Campaigns: Use popular tags and popularity indexes to conduct targeted marketing and promotion activities for high-traffic stations. Provide discounts or promotional activities at low-traffic stations to attract more passengers. Operation Management: Optimize vehicle scheduling and driver scheduling based on the usage time intervals and last usage time of stations. Predict peak hours and prepare resources in advance to cope with demand peaks. Customer Service: Provide personalized service recommendations by analyzing passenger travel data, such as recommending the best travel time and routes based on passengers' travel habits. Step 1: Collect customized passenger order information: including order number, order creation time, departure city, departure station, longitude and latitude of departure station, order amount, etc. Define station usage time interval as the time span (in days) from the first use to the last use of the station. Step 2: Standardize data: Standardize station usage times and total amounts to eliminate the impact of different measurement units. Classify, aggregate and summarize data of the same station, and calculate the first order time and last order time of this station based on the order creation time. Step 3: Apply weights and calculate popularity index: Combine the station usage time interval to calculate the time index = 1 / station usage time interval * 100; Formulate the calculation formula for the popularity index to reflect the usage frequency and sustainability of the station, and assign weights to each indicator: weight of station usage times: 0.5; weight of cumulative amount: 0.3; weight of time index: 0.2. Calculate the popularity index: [(station usage times * weight 0.5) + (cumulative amount * weight 0.3) + (time index * weight 0.2)] / 1000, so as to calculate the popularity index of each station. Step 4: Set thresholds and mark popular tags: According to the distribution of popularity indexes, set thresholds to divide stations into five different popularity levels: - Highly Popular: index greater than 100; - Medium-High Popularity: index greater than 25; - Medium Popularity: index greater than 8; - Medium-Low Popularity: index greater than 2; - Low Popularity: index less than 2