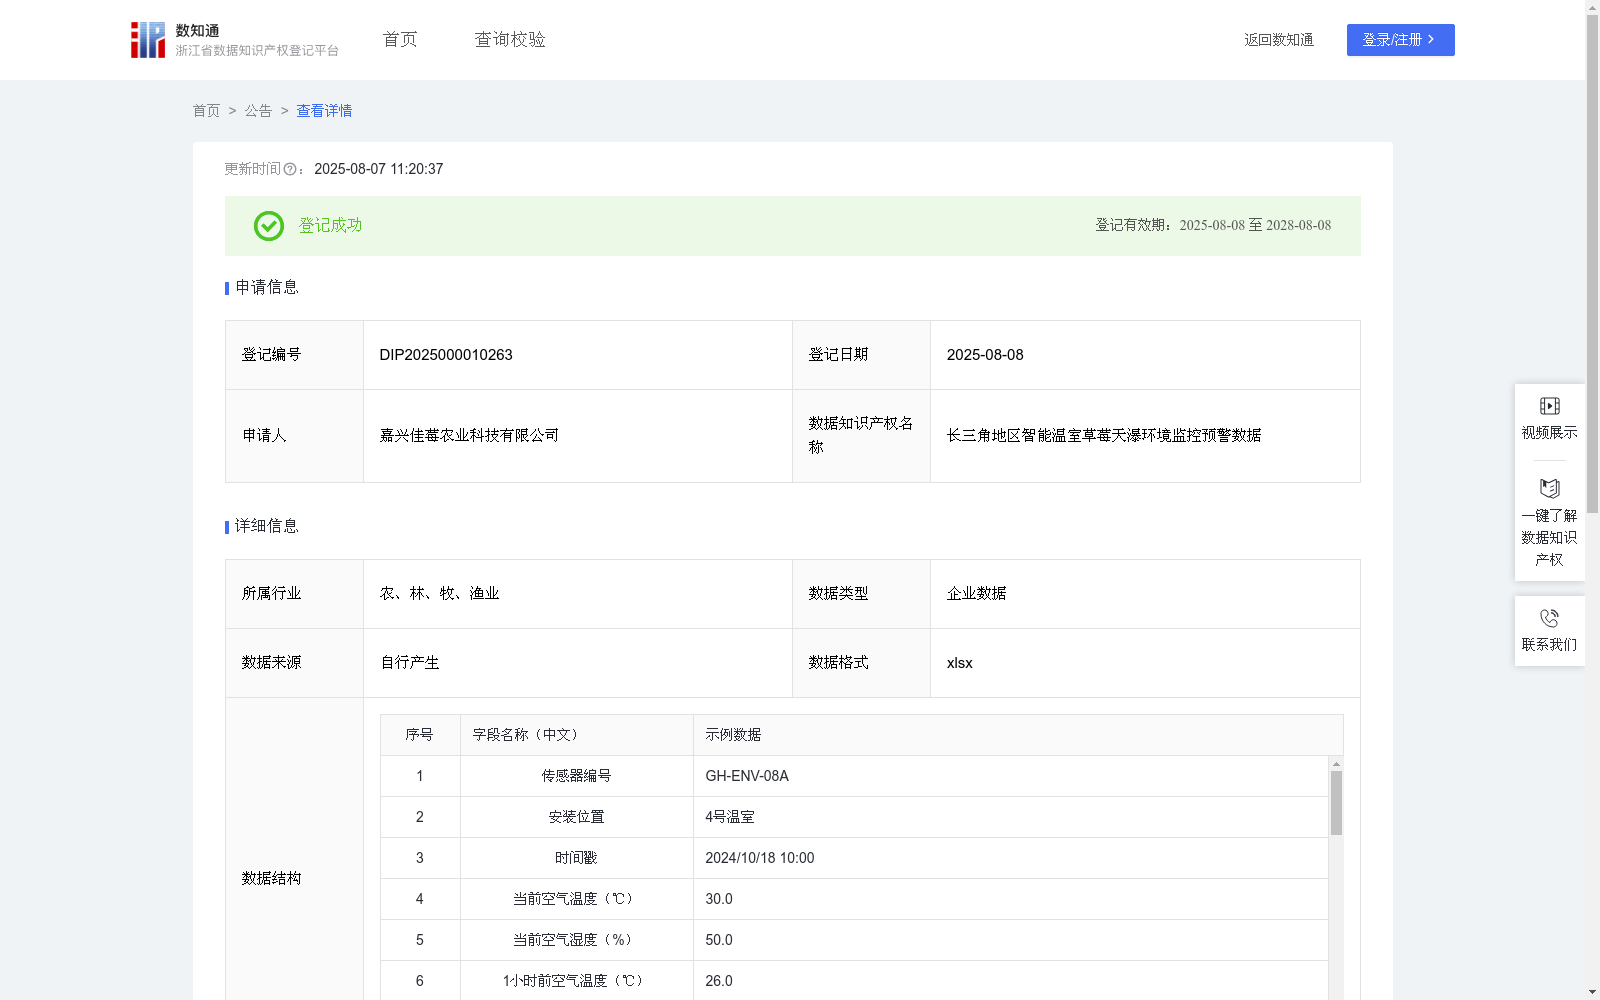
长三角地区智能温室草莓天瀑环境监控预警数据
收藏浙江省数据知识产权登记平台2025-08-07 更新2025-08-08 收录
下载链接:
https://www.zjip.org.cn/home/announce/trends/160185
下载链接
链接失效反馈官方服务:
资源简介:
在长三角地区草莓无土栽培基地,系统实时采集温湿度、CO₂、光照及基质温度数据,通过动态特征计算(如温度突变率、稳定度指数、CO₂消耗速率)生成综合异常指数,驱动精准决策:当避免草莓因高温日灼导致果实软化;基于光照变化率与CO₂消耗速率的耦合分析,动态优化补光策略,降低冬季能耗。同时,系统通过湿度突变率与温度稳定度指数的协同预警,实时标记灰霉病高风险区,联动水肥系统降低灌溉频次,减少农药用量。此数据模型可迁移至同类高附加值作物(如番茄、蝴蝶兰等),实现跨区域标准化复制,为长三角设施农业增效降险。
"一、数据采集
1.数据来源:
使用耘小果-多要素环境监测仪实时采集空气温度、湿度、CO2浓度和光照强度
使用土壤温湿度与电导率传感器采集基质温度
采集频率:每5分钟一次,24小时不间断监测
2.数据清洗:范围过滤,剔除超出合理范围的数据。
二、动态特征计算
1.计算突变率:
温度突变率 = (当前温度 - 1小时前温度) ÷ 1小时
湿度突变率 = (当前湿度 - 1小时前湿度) ÷ 1小时
CO2消耗速率 = (当前CO2浓度 - 1小时前CO2浓度) ÷ 1小时
光照变化率 = (当前光照强度 - 1小时前光照强度) ÷ 1小时
2.稳定度指数计算:
温度稳定度指数 = 1 ÷ (近3小时温度序列标准差 + 0.01)
湿度稳定度指数 = 1 ÷ (近3小时湿度序列标准差 + 0.01)
标准差利用方差公式
3.系数转换:
温度突变系数 = 温度突变率绝对值 ÷ 5(结果大于1时取1)
温度梯度系数 = 近3小时最大温度变化率 ÷ 4(结果大于1时取1)
温度失稳系数 = 1 - (温度稳定度指数 × 2)(结果小于0时取0)
三、异常检测与预警
1.异常指数计算:
温度异常指数 = (温度突变系数 × 0.4) + (温度梯度系数 × 0.3) + (温度失稳系数 × 0.3)
湿度异常指数 = 湿度突变率绝对值 ÷ 15(结果大于1时取1)
综合异常指数 = MAX(温度异常指数, 湿度异常指数)
2、分级预警:
若综合异常指数 ≥ 0.7,即红色预警(高风险),立即设备干预+人工核查;
若0.5 ≤ 综合异常指数 < 0.7,即黄色预警(中风险),自动调控+预警通知;
若综合异常指数 < 0.5,即蓝色预警(低风险),持续监测。"
In soilless strawberry cultivation bases in the Yangtze River Delta region, the system collects real-time data including air temperature and humidity, CO₂ concentration, light intensity and substrate temperature. It generates comprehensive anomaly indexes via dynamic feature calculation (such as temperature mutation rate, stability index, CO₂ consumption rate) to drive precise decision-making: preventing strawberry fruit softening caused by high-temperature sunscald; dynamically optimizing light supplementation strategies based on the coupling analysis of light change rate and CO₂ consumption rate to reduce winter energy consumption. Meanwhile, the system conducts collaborative early warning by combining humidity mutation rate and temperature stability index, marks high-risk areas of gray mold disease in real time, and links with the fertigation system to lower irrigation frequency and reduce pesticide usage. This data model can be transferred to similar high-value-added crops (e.g., tomatoes, Phalaenopsis, etc.) to achieve standardized cross-regional replication, enhancing efficiency and reducing risks for protected agriculture in the Yangtze River Delta.
## 1. Data Collection
### 1.1 Data Sources
- Yunxiaoguo multi-parameter environmental monitor is used to collect air temperature, humidity, CO₂ concentration and light intensity in real time
- Soil temperature, humidity and electrical conductivity sensors are used to collect substrate temperature
- Collection frequency: once every 5 minutes, 24-hour uninterrupted monitoring
### 1.2 Data Cleaning: Perform range filtering to eliminate data beyond reasonable ranges
## 2. Dynamic Feature Calculation
### 2.1 Mutation Rate Calculation
- Temperature mutation rate = (current temperature - temperature 1 hour ago) / 1 hour
- Humidity mutation rate = (current humidity - humidity 1 hour ago) / 1 hour
- CO₂ consumption rate = (current CO₂ concentration - CO₂ concentration 1 hour ago) / 1 hour
- Light change rate = (current light intensity - light intensity 1 hour ago) / 1 hour
### 2.2 Stability Index Calculation
- Temperature stability index = 1 / (standard deviation of the 3-hour temperature sequence + 0.01)
- Humidity stability index = 1 / (standard deviation of the 3-hour humidity sequence + 0.01)
* Standard deviation is calculated using the variance formula
### 2.3 Coefficient Conversion
- Temperature mutation coefficient = absolute value of temperature mutation rate / 5 (capped at 1 if the result exceeds 1)
- Temperature gradient coefficient = maximum temperature change rate in the past 3 hours / 4 (capped at 1 if the result exceeds 1)
- Temperature instability coefficient = 1 - (temperature stability index × 2) (capped at 0 if the result is less than 0)
## 3. Anomaly Detection and Early Warning
### 3.1 Anomaly Index Calculation
- Temperature anomaly index = (temperature mutation coefficient × 0.4) + (temperature gradient coefficient × 0.3) + (temperature instability coefficient × 0.3)
- Humidity anomaly index = absolute value of humidity mutation rate / 15 (capped at 1 if the result exceeds 1)
- Comprehensive anomaly index = MAX(temperature anomaly index, humidity anomaly index)
### 3.2 Graded Early Warning
- If comprehensive anomaly index ≥ 0.7: Red Alert (high risk), immediate equipment intervention + manual verification
- If 0.5 ≤ comprehensive anomaly index < 0.7: Yellow Alert (medium risk), automatic regulation + early warning notification
- If comprehensive anomaly index < 0.5: Blue Alert (low risk), continuous monitoring
提供机构:
嘉兴佳莓农业科技有限公司
创建时间:
2025-07-04
搜集汇总
数据集介绍
背景与挑战
背景概述
该数据集记录了长三角地区智能温室草莓种植的环境监控数据,包含温湿度、CO2浓度和光照强度等多种参数,每日更新,用于精准农业决策和风险预警。数据来源于嘉兴佳莓农业科技有限公司,适用于草莓等作物的无土栽培环境监控。
以上内容由遇见数据集搜集并总结生成


