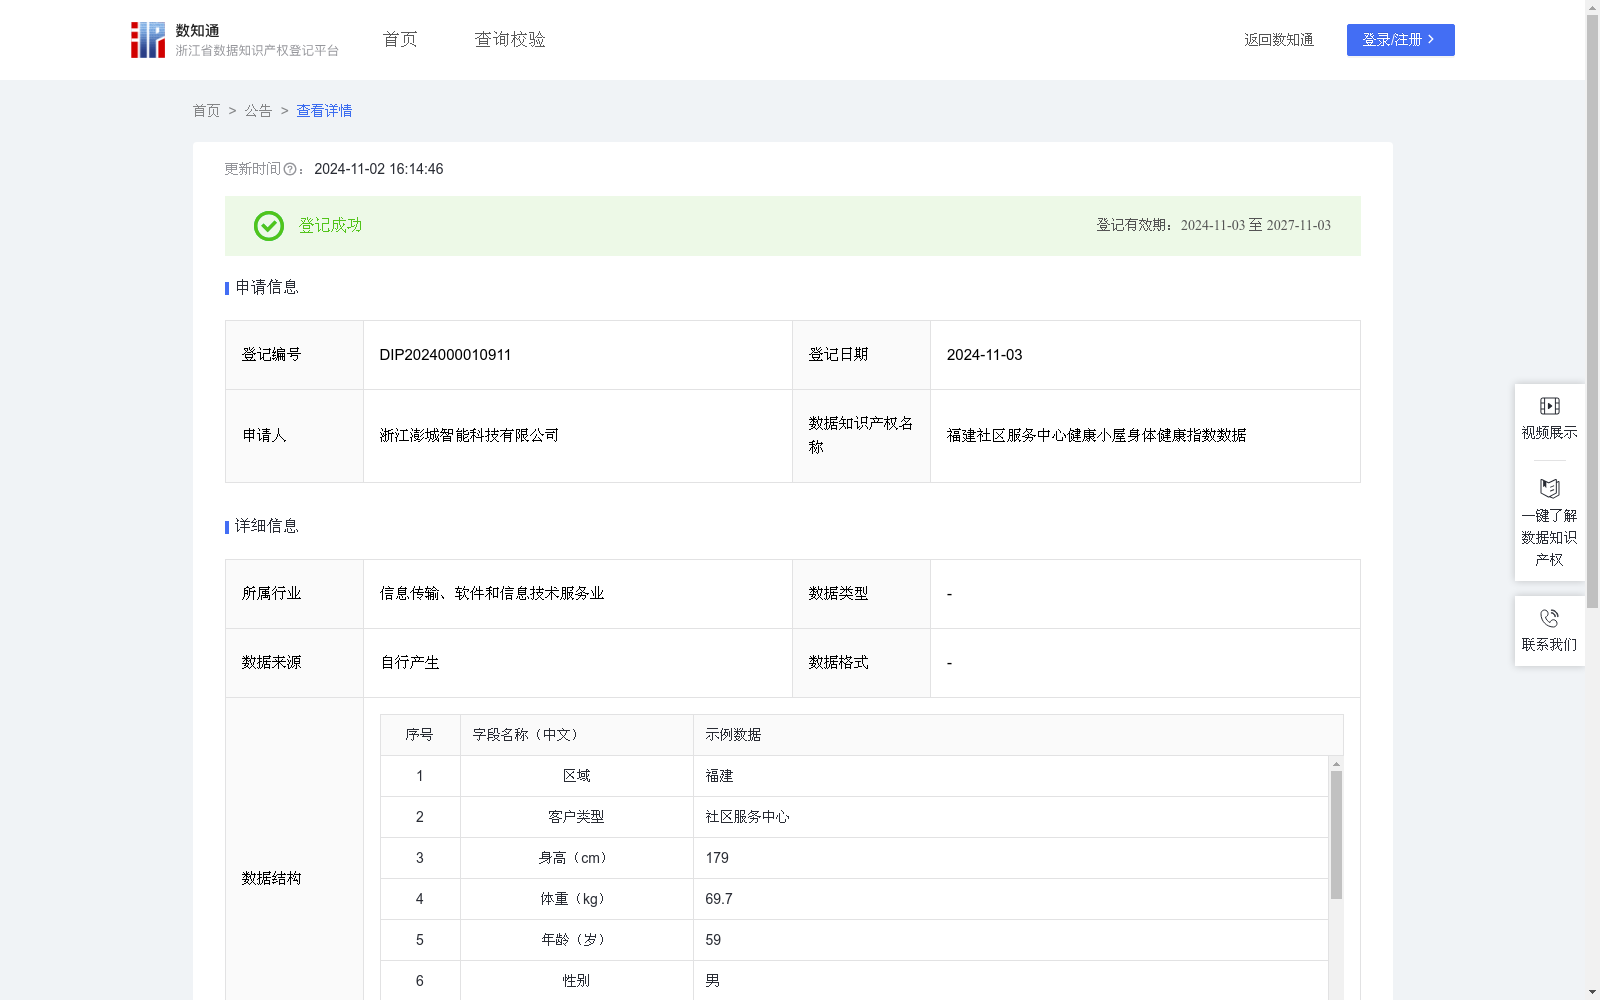
福建社区服务中心健康小屋身体健康指数数据
收藏浙江省数据知识产权登记平台2024-11-02 更新2024-11-03 收录
下载链接:
https://www.zjip.org.cn/home/announce/trends/80319
下载链接
链接失效反馈官方服务:
资源简介:
通过采集健康小屋平台上福建社区服务中心所服务用户的日常健康检测,完成对用户心脏健康评估,心血管疾病评估、体脂率、基础代谢、血液粘稠度、疲劳度、情绪压力等因素为自变量,综合分析个人的健康指数,健康小屋帮助用户更好地了解自己的健康状况,及时发现潜在问题,并提供个性化的健康建议和支持。
本数据适用于:
社区服务中心:为社区居民提供了一站式的健康管理解决方案,无论是日常监测、疾病管理还是康复训练,通过该指数为用户提供个性化的饮食和运动的建议。通过本公司健康小屋平台,采集福建社区服务中心的数据,完成对福建社区服务中心服务对象的健康检测和评估;将数据预处理后,输入到随机森林模型中,根据模型中各因素水平的分值得出膳食推荐指数。
综合多棵决策树的预测结果,最终的身体健康指数公式为:
= (1/N) * ∑(i=1 to N) Ti(x)
N 是随机森林中决策树的数量;
Σ(i=1 to N) 表示从1到N的求和;
Ti(x) 是第i个决策树对输入x的预测输出;
X是输入的身体指标特征向量(身高、体重、年龄、性别、心率、BMI、体脂率、基础代谢、收缩压、血液粘稠度、血清总胆固醇、糖尿病、吸烟、情绪压力、疲劳度)。
By collecting routine health detection data of users served by Fujian Community Service Centers via the Health Cabin platform, this dataset conducts cardiac health assessment and cardiovascular disease risk assessment, takes factors including body fat rate, basal metabolism, blood viscosity, fatigue level and emotional stress as independent variables, and comprehensively analyzes individual health index. The Health Cabin assists users in better understanding their own health status, detecting potential problems timely, and providing personalized health advice and support.
This dataset is applicable to:
Community Service Centers: They provide one-stop health management solutions for community residents, covering daily monitoring, disease management and rehabilitation training, and offer personalized diet and exercise recommendations to users based on the calculated health index. Data collected from Fujian Community Service Centers via the company's Health Cabin platform is used to conduct health detection and assessment for the service recipients of Fujian Community Service Centers. After data preprocessing, the data is input into the random forest model, and the dietary recommendation index is derived based on the scores of each factor level in the model.
By integrating the prediction results of multiple decision trees, the final physical health index formula is:
$$ = frac{1}{N} sum_{i=1}^{N} T_i(x) $$
Where N is the number of decision trees in the random forest;
$sum_{i=1}^{N}$ represents the summation from 1 to N;
$T_i(x)$ is the prediction output of the i-th decision tree for input $x$;
$X$ is the input physical indicator feature vector, including height, weight, age, gender, heart rate, BMI, body fat rate, basal metabolism, systolic blood pressure, blood viscosity, serum total cholesterol, diabetes, smoking status, emotional stress and fatigue level.
提供机构:
浙江澎城智能科技有限公司
创建时间:
2024-10-09
搜集汇总
数据集介绍
特点
该数据集包含福建社区服务中心健康小屋平台上1001条用户健康检测数据,每日更新,涵盖身高、体重、心率、体脂率等14个健康指标,用于评估用户身体健康指数并提供个性化健康建议。
以上内容由遇见数据集搜集并总结生成


