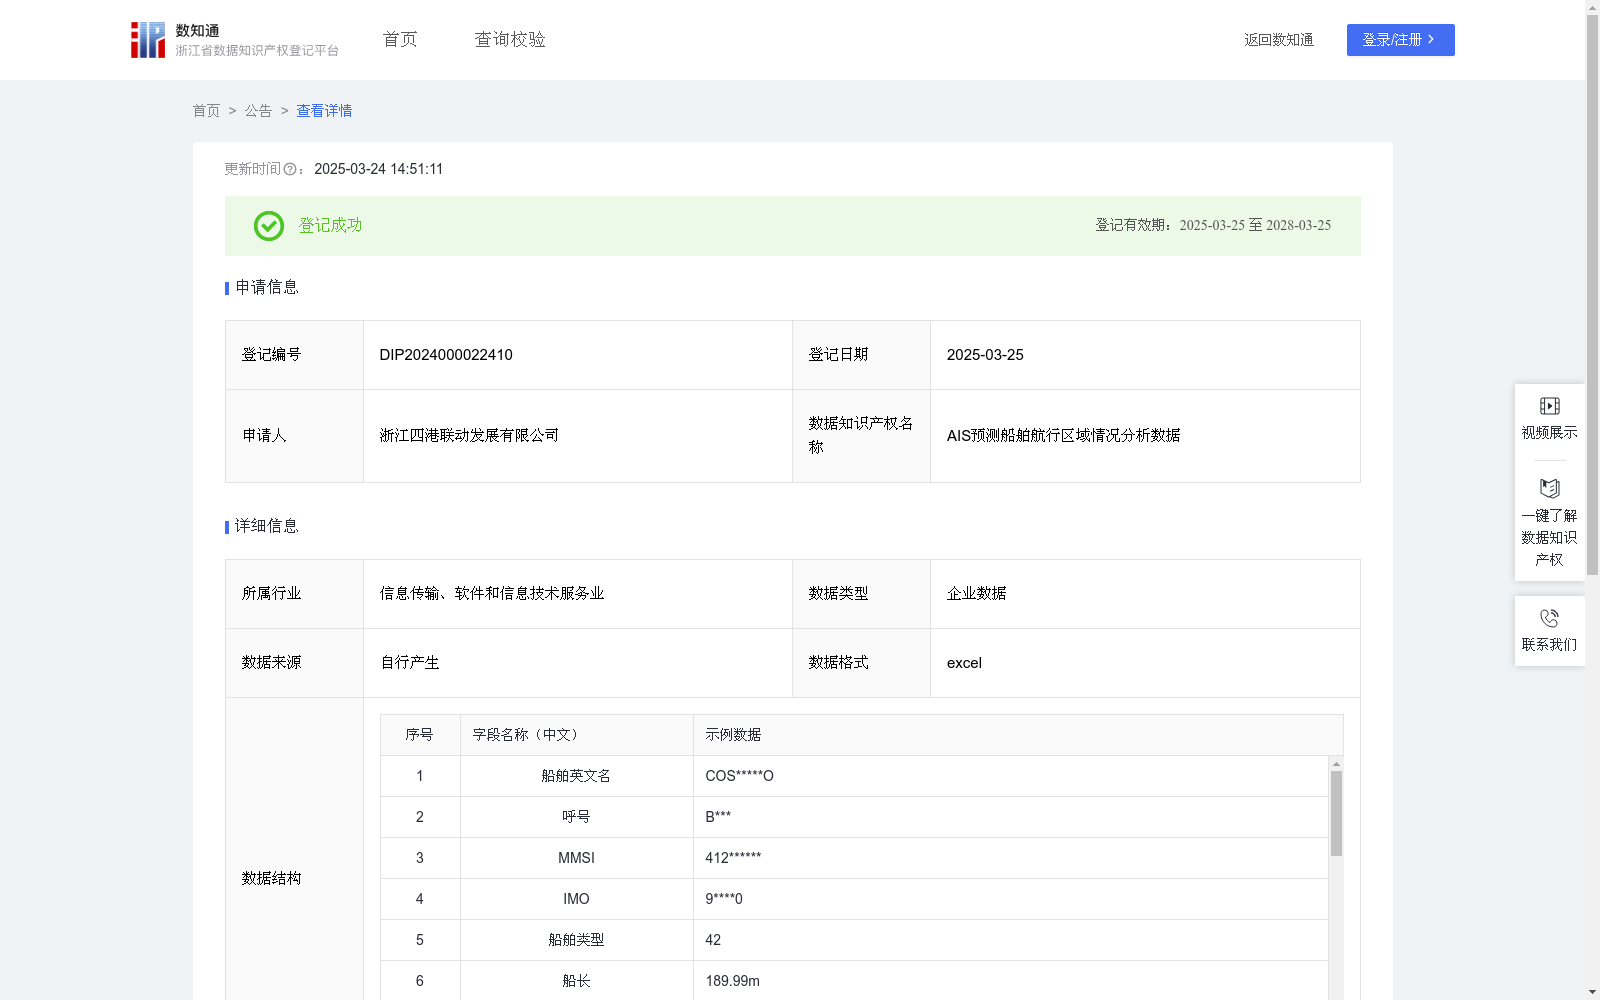
AIS预测船舶航行区域情况分析数据
收藏浙江省数据知识产权登记平台2025-03-24 更新2025-03-25 收录
下载链接:
https://www.zjip.org.cn/home/announce/trends/119540
下载链接
链接失效反馈官方服务:
资源简介:
对AIS船舶轨迹记录分析,掌握船舶经纬度信息,分析船舶间相对位置,对船舶所在区域进行分类,将船舶所在区域状态分为拥堵状态和正常状态,对船舶航行进行预警,有助于同行业其他企业识别航线上的潜在瓶颈和拥堵时段,从而优化航线规划,减少航行时间和成本,并更为精准地部署港口资源和服务,在拥堵时段提供更为高效的服务。1、数据采集:通过四港联动AIS数据库输出船名、经度、纬度、出发港、目的港、航首向等字段;
2、数据处理:对采集到的数据进行清洗、分类汇总,对船舶名称进行匿名化处理。
3、数据加工:记Dij为代号为i和代号为j的船舶之间的距离,根据航线L(数据样例中航线为CNJYN——MOIN)以及船速S,算出时间1小时后,船舶沿着航线行驶Y=S*1海里,根据航线经纬度信息,对应船舶正常航行1小时后在航线上的位置P,以P为圆心,半径为5公里划定范围,将此范围记为T,穷举范围T内任意两个船舶组合,并计算每个组合两个船舶之间的距离,求和记为A,以及在范围T内的船舶数B,设定距离和阀值C,以及船舶数阀值D,若(A>C)U(B>D),则判断为拥堵,其他情况判定为正常。
数据应用:帮助船舶公司更好地感知船舶当前海域和预知一段时间后船舶将要驶入的海域的拥挤情况,提前给船舶预警。
This dataset is designed for analysis of Automatic Identification System (AIS) vessel trajectories. It acquires vessel longitude and latitude information, analyzes the relative positions between vessels, classifies the sea areas where vessels are located into two states: congested and normal, and issues navigation warnings for vessels. It helps other enterprises in the same industry identify potential bottlenecks and congestion periods on shipping routes, thereby optimizing route planning, reducing navigation time and costs, deploying port resources and services more accurately, and delivering more efficient services during congestion periods.
1. Data Collection: Output fields including vessel name, longitude, latitude, port of departure, port of destination, vessel heading, etc. via the Four Port Interconnected AIS Database.
2. Data Processing: Clean, classify and summarize the collected data, and perform anonymization on vessel names.
3. Data Refinement: Let D_ij represent the distance between vessel i and vessel j. Given the shipping route L (the sample route is CNJYN——MOIN) and vessel speed S, calculate the distance Y that the vessel travels along the route within 1 hour, which equals Y = S * 1 nautical mile. Based on the longitude and latitude information of the route, determine the position P of the vessel on the route after normal navigation for 1 hour. Take P as the center and delineate a range T with a radius of 5 kilometers. Enumerate all pairs of vessels within range T, calculate the sum of the distances between each pair of vessels, denoted as A, and count the number of vessels within range T, denoted as B. Set the distance sum threshold C and vessel count threshold D. If (A > C) OR (B > D), the area is judged as congested; otherwise, it is judged as normal.
Data Applications: Assist shipping companies in better perceiving the current sea area where vessels are located and predicting the congestion status of the sea area that vessels will enter within a certain period of time, and issue early warnings to vessels in advance.
提供机构:
浙江四港联动发展有限公司
创建时间:
2024-12-09
搜集汇总
数据集介绍
背景与挑战
背景概述
该数据集是由浙江四港联动发展有限公司提供的AIS预测船舶航行区域情况分析数据,包含999条记录,每日更新。数据集通过分析船舶轨迹记录,对船舶所在区域进行分类,分为拥堵状态和正常状态,旨在优化航线规划,减少航行时间和成本。
以上内容由遇见数据集搜集并总结生成


