食堂食品安全风险与餐具清洁度关联分析数据
收藏浙江省数据知识产权登记平台2024-11-15 更新2024-11-16 收录
下载链接:
https://www.zjip.org.cn/home/announce/trends/85339
下载链接
链接失效反馈官方服务:
资源简介:
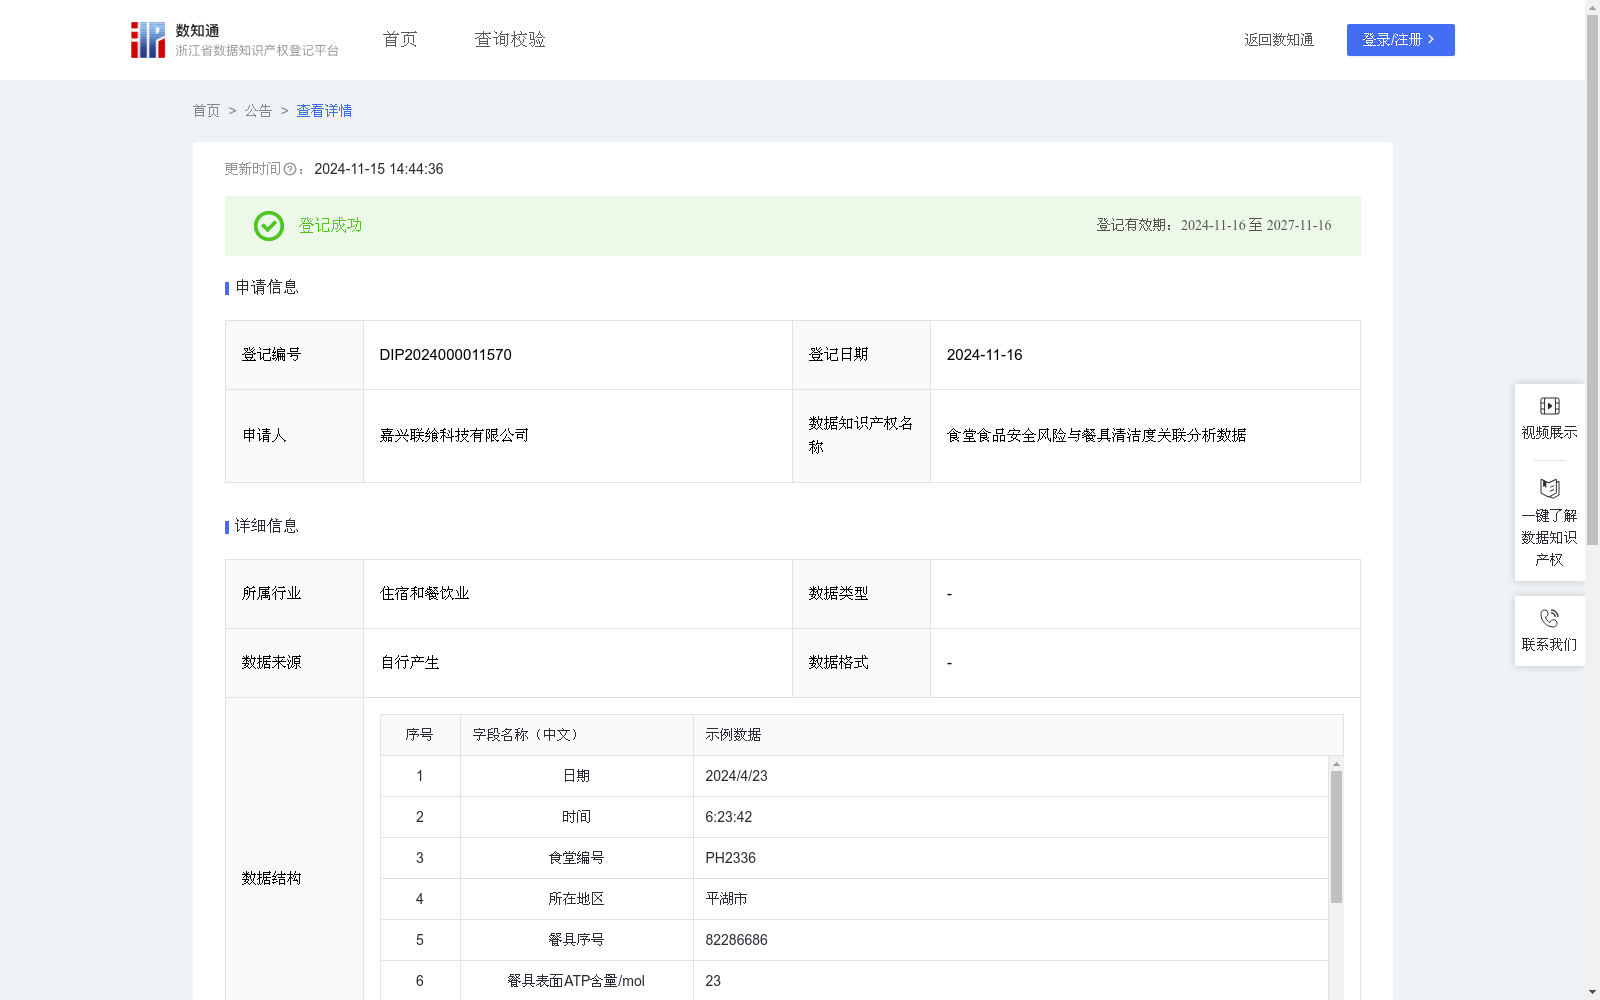
食堂食品安全风险与餐具清洁度关联分析数据是一个创新的量化工具,可用于评估因餐具卫生不洁净可能对食品安全造成的风险程度。 1.食堂可将本指数作为食品安全的日常监控工具,识别因餐具卫生不佳而可能造成的食品安全风险,从而优化餐具清洗、消毒等过程;对于依靠外部厂商供应餐具的食堂,食堂也可以将本指数作为依据,对供应商进行评价和考核。2.餐饮监管部门可以利用本数据作为监管食堂食品安全的依据之一,可通过指数的变化及时发现食品安全风险较高的食堂,提前进行干预和指导。3.食堂或和监管机构可以将本数据对外披露公开,体现本单位或本地区对餐具卫生的重视和承诺,有利于增强用餐者的信任。4.保险公司可根据本数据提前识别目标食堂客户的投保风险,从而确定相关保险产品的定价,如食品安全责任险。5.本数据还能为餐具卫生测试仪器厂家对仪器进行功能改进或提升提供依据。1.数据抽取和预处理: (1)数据抽取:在自研的5G智慧食安工业物联网数字化管理平台数据库中抽取相关食堂的餐具卫生情况数据,包括日期、时间、食堂编号、所在地区、餐具序号、餐具表面APT含量。(2)数据预处理:对抽取的数据进行清洗,去除重复、错误或无关的信息,以便后续的分析和建模。 2.基于餐具卫生情况统计数据预测食堂食品安全风险数据: (1)ATP含量状态判定:若ATP含量<30,则为正常;若≥30且≤100,则为警告;若>100,则为异常; (2)计算近30日的总判定次数、警告次数和异常次数:利用SUM函数对近30日的总判定次数进行累加;利用CountIf函数分别对近30日的警告次数和异常次数进行累加; (3)计算近30日的警告率和异常率:近30日警告率=近30日警告次数÷近30日总判定次数×100%;近30日异常率=近30日异常次数÷近30日总判定次数×100%; (4)建立食堂食品安全风险评估模型:基于餐具卫生情况统计的食堂食品安全风险指数=近30日警告率×40+近30日异常率×60;40和60为对应的系数,根据警告和异常两种情况对食品安全的影响程度并结合行业经验确定。
This dataset for correlation analysis between canteen food safety risks and tableware cleanliness is an innovative quantitative tool for evaluating the potential severity of food safety risks caused by unclean tableware hygiene.
1. Canteens can use this index as a daily monitoring tool for food safety, identify potential food safety risks caused by poor tableware hygiene, and optimize tableware washing, disinfection and other related processes. For canteens that outsource tableware supply to external manufacturers, this index can also serve as a basis for evaluating and assessing their suppliers.
2. Food Safety Regulatory Authorities can use this dataset as one of the bases for supervising canteen food safety, identify canteens with elevated food safety risks in a timely manner through changes in the index, and conduct early intervention and guidance.
3. Canteens or regulatory authorities can disclose this dataset publicly to demonstrate their unit's or the region's emphasis on and commitment to tableware hygiene, which helps enhance the trust of dining consumers.
4. Insurance companies can use this dataset to proactively identify insurance risks of target canteen clients, so as to determine the pricing of relevant insurance products, such as Food Safety Liability Insurance.
5. This dataset can also provide a reference for tableware hygiene testing instrument manufacturers to improve or upgrade the functions of their instruments.
1. Data Extraction and Preprocessing:
(1) Data Extraction: Extract tableware hygiene data of relevant canteens from the database of the self-developed 5G Smart Food Safety Industrial Internet of Things (IIoT) Digital Management Platform, including date, time, canteen number, location, tableware serial number, and ATP content on the tableware surface.
(2) Data Preprocessing: Clean the extracted data to remove duplicate, erroneous or irrelevant information for subsequent analysis and modeling.
2. Prediction of Canteen Food Safety Risk Data Based on Statistical Tableware Hygiene Data:
(1) ATP Content Status Judgment: If ATP content < 30, it is normal; if 30 ≤ ATP content ≤ 100, it is a warning; if ATP content > 100, it is abnormal;
(2) Calculate the total number of judgments, warning occurrences and abnormal occurrences within the past 30 days: Use the SUM function to accumulate the total number of judgments within the past 30 days; use the COUNTIF function to accumulate the number of warning occurrences and abnormal occurrences respectively within the past 30 days;
(3) Calculate the warning rate and abnormal rate within the past 30 days: Warning rate within the past 30 days = (Number of warning occurrences within the past 30 days / Total number of judgments within the past 30 days) × 100%; Abnormal rate within the past 30 days = (Number of abnormal occurrences within the past 30 days / Total number of judgments within the past 30 days) × 100%;
(4) Establish a canteen food safety risk assessment model: The canteen food safety risk index based on statistical tableware hygiene data = Warning rate within the past 30 days × 40 + Abnormal rate within the past 30 days × 60; The coefficients 40 and 60 are determined based on the impact degrees of warning and abnormal situations on food safety, combined with industry experience.
提供机构:
嘉兴联飨科技有限公司
创建时间:
2024-10-16
搜集汇总
数据集介绍
特点
该数据集提供了食堂餐具卫生情况的详细记录,包括ATP含量、状态判定及食品安全风险指数,适用于食品安全风险分析和监管。
以上内容由遇见数据集搜集并总结生成


