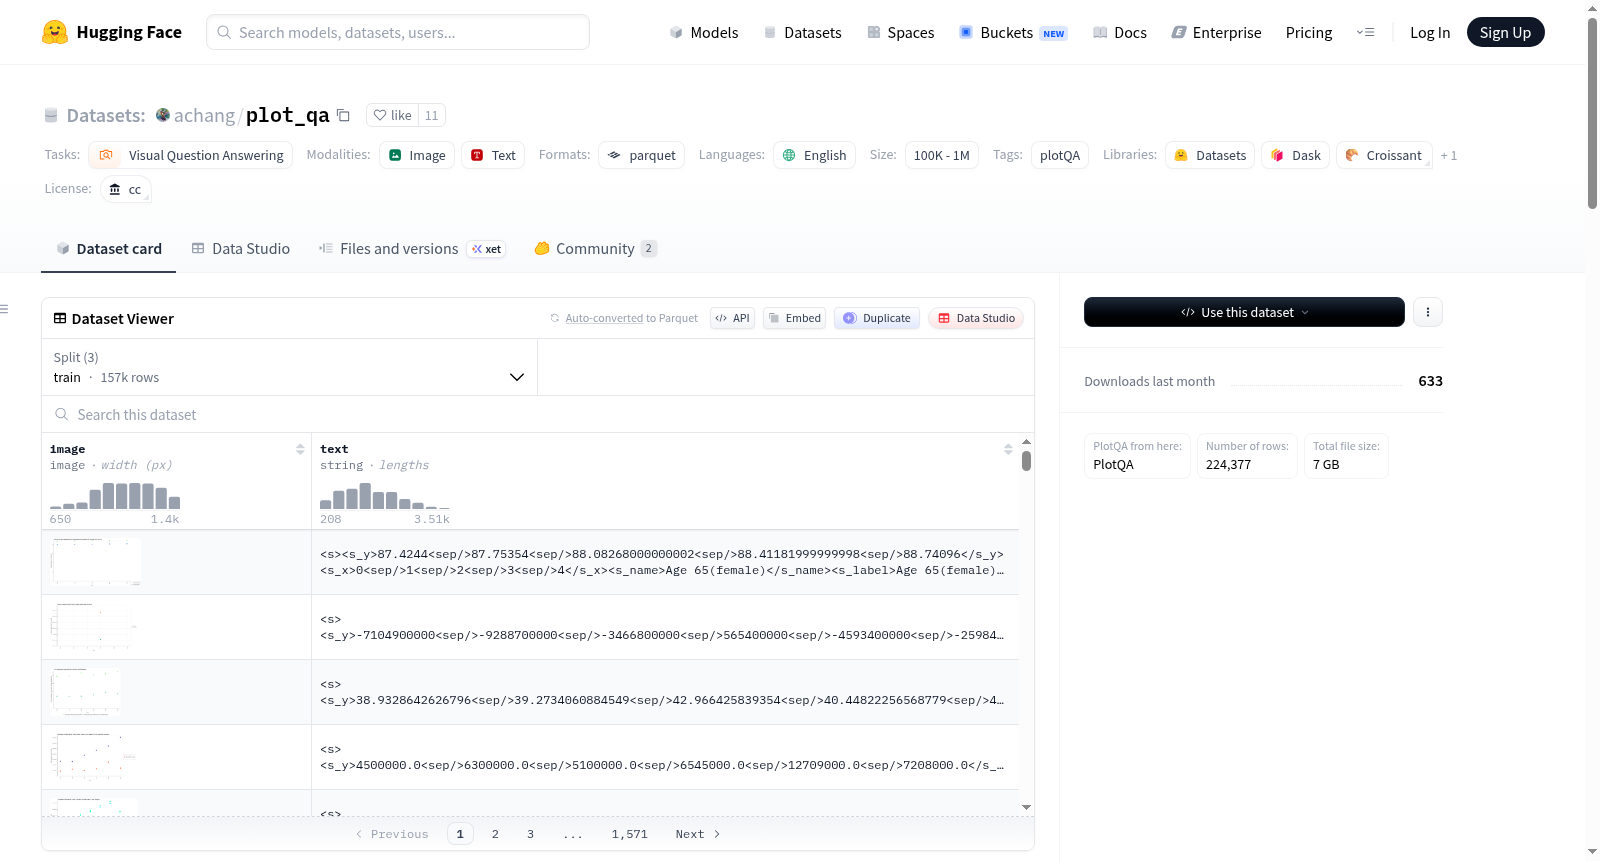
achang/plot_qa
收藏Hugging Face2023-02-12 更新2024-03-04 收录
下载链接:
https://hf-mirror.com/datasets/achang/plot_qa
下载链接
链接失效反馈官方服务:
资源简介:
---
license: cc
task_categories:
- visual-question-answering
language:
- en
tags:
- plotQA
pretty_name: PlotQA
---
# Dataset Card for PlotQA
## Dataset Description
- **PlotQA from here:** [PlotQA](https://github.com/NiteshMethani/PlotQA)
### Dataset Summary
PlotQA is a VQA dataset with 28.9 million question-answer pairs grounded over 224,377 plots on data from real-world sources and questions based on crowd-sourced question templates.
## Dataset Structure
### Data Fields
List and describe the fields present in the dataset. Mention their data type, and whether they are used as input or output in any of the tasks the dataset currently supports. If the data has span indices, describe their attributes, such as whether they are at the character level or word level, whether they are contiguous or not, etc. If the datasets contains example IDs, state whether they have an inherent meaning, such as a mapping to other datasets or pointing to relationships between data points.
- `image`: PIL image of a plot
- `text`: string of json data 'models'. See notes below.
From [here](https://github.com/NiteshMethani/PlotQA/blob/master/PlotQA_Dataset.md):
'models': It is a list of dictionaries. Depending on the type of the plot (single or 2,3,4-multi), the length of the dictionary can vary from 1 to 4. Each dictionary contains the following keys-
name: Label corresponding to the datapoint.
color: Color corresponding to the `name` datapoint.
bboxes: Bounding boxes corresponding to the `name` datapoints in the plot.
label: label corresponding to the datapoint which will appear as the legend (same as the `name` field).
x: x-value of the datapoints.
y: y-value of the datapoints.
[json2token](https://github.com/clovaai/donut/blob/b317b4bbf1eecec7c62e7666f2097e1e90a6b441/donut/model.py#L495) function was used to convert json to string.
The new tokens are already loaded in plotQA processor:
```
from transformers import DonutProcessor
processor = DonutProcessor.from_pretrained("[achang/donut-plotqa-trained](https://huggingface.co/achang/donut-plotqa-trained)")
```
### Data Splits
```
validation: Dataset({
features: ['image', 'text'],
num_rows: 33650
})
train: Dataset({
features: ['image', 'text'],
num_rows: 157070
})
test: Dataset({
features: ['image', 'text'],
num_rows: 33657
})
```
## Misc
Dataset Creation, Annotations, Considerations for Using the Data, Social Impact of Dataset, Additional Information, Licensing Information look at [plotQA](https://github.com/NiteshMethani/PlotQA)
### Citation Information
Please cite the following if you use the PlotQA dataset in your work:
```
@InProceedings{Methani_2020_WACV,
author = {Methani, Nitesh and Ganguly, Pritha and Khapra, Mitesh M. and Kumar, Pratyush},
title = {PlotQA: Reasoning over Scientific Plots},
booktitle = {The IEEE Winter Conference on Applications of Computer Vision (WACV)},
month = {March},
year = {2020}
}
```
提供机构:
achang
原始信息汇总
数据集概述
数据集描述
- 名称: PlotQA
- 来源: PlotQA
- 概述: PlotQA是一个视觉问答(VQA)数据集,包含28.9百万个问题-答案对,基于224,377个实际数据源的图表和基于众包问题模板的问题。
数据集结构
数据字段
image: 图表的PIL图像格式。text: JSON数据字符串,包含多个字段如name,color,bboxes,label,x,y,用于描述图表中的数据点。
数据分割
- 训练集: 包含157,070个样本,特征为
image和text。 - 验证集: 包含33,650个样本,特征为
image和text。 - 测试集: 包含33,657个样本,特征为
image和text。
许可证
- 许可证: cc
引用信息
若使用PlotQA数据集,请引用以下文献:
@InProceedings{Methani_2020_WACV, author = {Methani, Nitesh and Ganguly, Pritha and Khapra, Mitesh M. and Kumar, Pratyush}, title = {PlotQA: Reasoning over Scientific Plots}, booktitle = {The IEEE Winter Conference on Applications of Computer Vision (WACV)}, month = {March}, year = {2020} }
搜集汇总
数据集介绍
构建方式
在视觉问答(VQA)领域,科学图表理解一直是极具挑战性的研究方向。PlotQA数据集应运而生,旨在填补现有数据集在复杂图表推理能力上的空白。该数据集基于真实世界来源的数据,构建了224,377幅科学图表,并通过众包问题模板生成了2,890万个问答对。每一幅图表均以PIL图像形式存储,并附带详尽的JSON结构元数据,涵盖数据点的名称、颜色、边界框、坐标轴标签及数值,确保了图文信息的高度对齐与结构化的语义表达。
特点
PlotQA数据集的核心特点在于其规模宏大且结构严谨。它不仅包含了海量的问答对,更覆盖了单图与多子图(2至4幅)的复杂场景,能够全面评估模型在图表解析、数值推理与逻辑推断等多维度能力。每个数据样本的JSON元数据完整记录了图例、坐标值与边界框信息,为模型提供了丰富的视觉与语义线索。此外,数据集已明确划分为训练、验证与测试集,分别包含157,070、33,650与33,657个样本,便于进行标准化评估与比较。
使用方法
使用PlotQA数据集时,推荐采用Donut处理器进行高效预处理。首先,通过DonutProcessor将图表图像转换为像素张量,并利用其分词器将JSON文本序列化为固定长度的输入ID序列。对于标签处理,需将填充符对应的token ID替换为忽略标记,以避免模型在训练时对无意义位置进行预测。用户可通过HuggingFace的load_dataset接口以流式方式加载数据,并结合partial函数将预处理逻辑映射至整个数据集,从而构建出可直接用于模型训练的像素值与标签对。
背景与挑战
背景概述
PlotQA数据集由Nitesh Methani等研究者于2020年在IEEE冬季计算机视觉应用会议上提出,其核心研究问题聚焦于视觉问答(VQA)领域中对科学图表的深度推理。该数据集由印度理工学院马德拉斯分校等机构主导构建,包含224,377张来自真实数据源的图表,并基于众包问题模板生成了约2890万个问答对,显著超越了以往图表问答数据集的规模与复杂度。PlotQA的发布推动了多模态理解研究从简单图像识别向复杂逻辑推理的跨越,尤其在科学文献分析、教育评估及自动化数据解读等场景中具有重要影响力,为模型在数值计算、趋势比较等高层语义任务上的能力评估提供了标准化基准。
当前挑战
PlotQA所解决的领域挑战在于,现有VQA模型难以处理图表中隐含的数值关系与多步推理需求,例如坐标轴数值读取、数据点间比例计算或跨序列趋势归纳,这要求模型同时具备光学字符识别、空间定位与算术推理能力。在数据集构建过程中,挑战包括:从异构真实数据源(如CSV文件)自动生成多样化图表布局时,需确保坐标轴标签、图例与数据点间的语义一致性;设计众包问题模板时需平衡问题类型的覆盖度与标注质量,避免模糊表述导致答案歧义;此外,对图表中边界框的精确标注以及数据点与文本描述的映射,均需耗费大量人工校验以降低噪声干扰。
常用场景
经典使用场景
PlotQA数据集在视觉问答领域占据着举足轻重的地位,其核心应用场景在于评测模型对科学图表的多模态理解与推理能力。该数据集涵盖了超过28.9百万个问答对,这些问答对基于22.4万张源自真实世界数据源的图表生成,通过众包问题模板精心构造。研究者常利用PlotQA来训练和评估模型在解析图表中的数值关系、趋势变化以及数据点定位等复杂任务上的表现,从而推动视觉语言模型从简单的图像识别迈向更深层次的逻辑推理。
实际应用
在实际应用层面,PlotQA数据集赋能了众多智能文档处理与自动化分析系统。例如,在金融、医疗和科研领域,自动从折线图、柱状图或散点图中提取关键信息并回答用户查询的需求日益迫切。基于PlotQA训练的模型能够辅助分析师快速生成报告摘要、识别异常数据点或对比多组实验数据,显著提升工作效率。此外,在教育场景中,这类技术可用于开发智能辅导工具,帮助学生理解复杂图表背后的数学与科学概念,实现个性化学习支持。
衍生相关工作
PlotQA数据集衍生了一系列具有深远影响的经典工作,其中最具代表性的是Donut模型在图表理解任务上的适配与优化。Donut作为一种基于Transformer的端到端文档理解模型,通过引入PlotQA数据集进行微调,显著提升了对图表中数值与文本的联合编码能力。此外,后续研究如ChartQA和FigureQA等基准的建立,也深受PlotQA设计理念的启发,进一步拓展了图表问答的边界。这些工作共同推动了多模态推理在科学文献分析、自动报告生成等前沿领域的应用落地。
以上内容由遇见数据集搜集并总结生成


