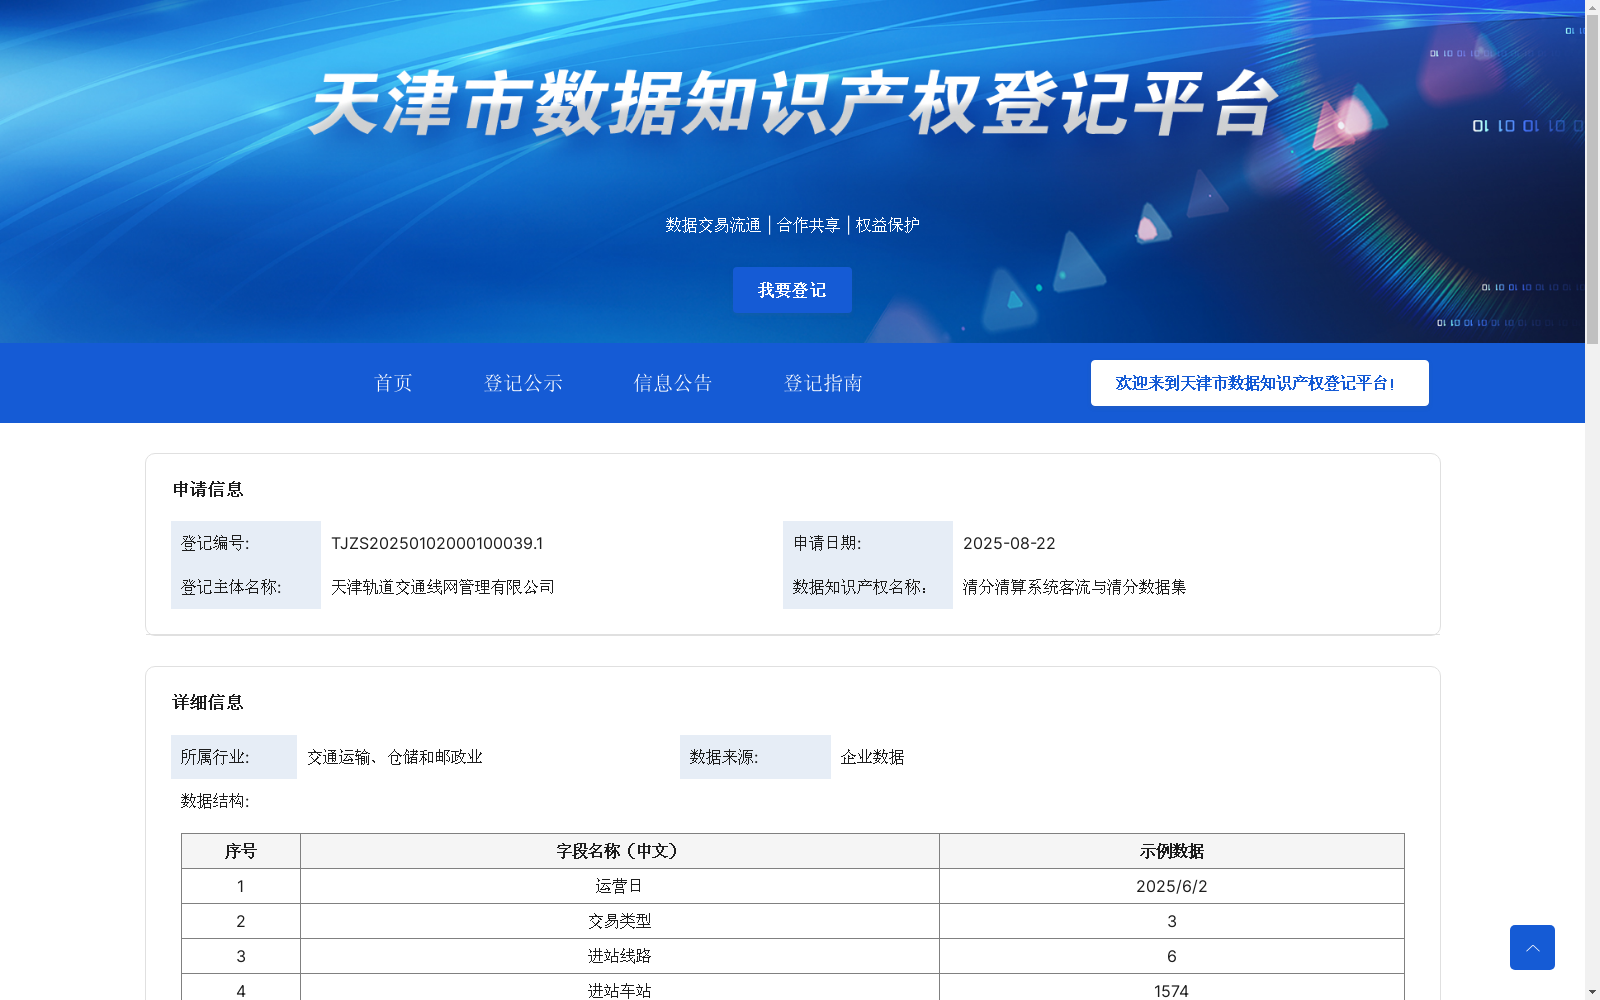
清分清算系统客流与清分数据集
收藏天津市数据知识产权登记平台2025-09-05 更新2025-09-18 收录
下载链接:
https://dengji.tjippc.cn/xxgg_nr?id=d1ab375f-f1c2-412a-991b-0b251c41ef0f
下载链接
链接失效反馈官方服务:
资源简介:
结合目前国内已经应用的客流监测情况,提出了车站客流密集度定义方法,全面实时地了反映地铁日常运营中车站的客流状态。本模型主要通过车站容纳量、车辆行车到站信息、CCTV监控信息、AFC实时票卡进出站数据、乘客乘车轨迹等基础数据,通过对比上周同期客流进出站数据,对当日实时进站客流轨迹进行预测,通过清分模型计算断面客流,综合搭建了地铁车站实时客流数据集:
(1)出站比例表计算。利用7天前的进出站数据汇总得到A站至B,C,D,E站出站人数,汇总时使用出站交易
如:11月19日8点0分至8点15分西康路车站120人进站分别在和平路(30人),鞍山道(50人),小白楼(40人)出站得出概率
西康路至和平路30/120=0.25
西康路至鞍山道50/120=0.41667
西康路至小白楼40/120=0.33333
(2)断面客流表计算。用APP推送的实时进站客流数量乘以出站比例推算出站车站,客流数量,出站时间
例如三分钟执行一次,执行时统计触发时间三分钟前至触发时间区间的车站实时进站数量和进站时间(触发时间),将该三分钟的交易一起汇总统计,所以统一使用触发时间当做进站时间来预测出站时间
举例:
实时客流8点至8点03西康路车站进站40人,
推算出站车站,客流数量,出站时间为:
40 x 0.25=西康路至和平路出站客流10人, 出站时间8点8分(使用8点03推算得出)
40 x 0.41667=西康路至鞍山道出站客流17人 出站时间8点10分(使用8点03推算得出)
40 x 0.33333=西康路至小白楼出站客流13人 出站时间8点12分(使用8点03推算得出)
(3)用预测出的OD,客流数量,出站时间进行断面计算并保存,计算方式与出站交易入库时计算断面类似,时间维度为3分钟一个时间段。
断面预测计算公式为: (三分钟区间实时车站进站数量(count) 乘 需预测时间段的OD概率 /100000得出结果四舍五入后) 乘 路段被选择概率 /100得出的结果再次四舍五入
(4)断面客流表计算。将计算出的断面客流量按标准推送给APP,推送间隔可配置.
(5)APP通过设置各线路拥挤度阀值,按照不通颜色显示客流密集度。
该套数据集归纳了全部数据需求,完善了基础数据的具体处理方法,同时对不同维度下的车站客流基础数据进行了归一化处理,通过地铁官方APP进行图形化展示。
Based on the currently applied passenger flow monitoring scenarios in China, this paper proposes a definition method for station passenger flow density, which comprehensively and in real-time reflects the passenger flow status of stations during daily metro operations. This model mainly uses basic data such as station capacity, vehicle arrival information, CCTV surveillance data, AFC real-time ticket entry and exit data, and passenger travel trajectories. By comparing the passenger flow entry and exit data from the same period last week, it predicts the real-time inbound passenger flow trajectories of the current day, calculates sectional passenger flow via the fare settlement model, and comprehensively constructs a real-time metro station passenger flow dataset:
(1) Calculation of outbound proportion table. The number of outbound passengers from Station A to Stations B, C, D, E is aggregated using 7-day-old entry and exit data, with outbound transaction records used for aggregation. For example: From 8:00 to 8:15 on November 19, 120 passengers entered Xikang Road Station and exited at Heping Road (30 people), Anshan Road (50 people), and Xiaobailou (40 people) respectively, resulting in the following probabilities:
Xikang Road to Heping Road: 30/120 = 0.25
Xikang Road to Anshan Road: 50/120 = 0.41667
Xikang Road to Xiaobailou: 40/120 = 0.33333
(2) Calculation of sectional passenger flow table. The outbound station, passenger volume, and outbound time are estimated by multiplying the real-time inbound passenger flow volume pushed by the APP with the outbound proportion. For example, the calculation is performed every 3 minutes. During execution, the real-time inbound passenger count and inbound time (trigger time) of the station within the interval from 3 minutes before the trigger time to the trigger time are counted, and all transactions within this 3-minute window are aggregated together. Therefore, the trigger time is uniformly used as the inbound time to predict the outbound time.
Example: 40 passengers entered Xikang Road Station from 8:00 to 8:03. The estimated outbound stations, passenger volumes, and outbound times are as follows:
40 × 0.25 = 10 outbound passengers from Xikang Road to Heping Road, with an outbound time of 8:08 (calculated based on 8:03)
40 × 0.41667 = 17 outbound passengers from Xikang Road to Anshan Road, with an outbound time of 8:10 (calculated based on 8:03)
40 × 0.33333 = 13 outbound passengers from Xikang Road to Xiaobailou, with an outbound time of 8:12 (calculated based on 8:03)
(3) Sectional flow calculation and storage are performed using the predicted OD pairs, passenger volumes, and outbound times. The calculation method is similar to that used when sectional flow is calculated during outbound transaction storage, with a time interval of 3 minutes per period. The sectional flow prediction calculation formula is: (Real-time inbound passenger count within the 3-minute window multiplied by the OD probability of the target prediction period, divided by 100000, then rounded) multiplied by the link selection probability, divided by 100, then rounded again.
(4) Calculation of sectional passenger flow table. The calculated sectional passenger flow is pushed to the APP according to standard specifications, and the push interval is configurable.
(5) The APP displays passenger flow density using different colors by setting congestion thresholds for each line.
This dataset summarizes all data requirements, improves the specific processing methods for basic data, normalizes the basic station passenger flow data across different dimensions, and presents the results graphically via the official metro APP.
提供机构:
天津轨道交通线网管理有限公司
创建时间:
2025-08-22
搜集汇总
数据集介绍
背景与挑战
背景概述
该数据集是天津轨道交通的客流与清分数据,包含9300条记录,每日更新,涵盖进站、出站、断面客流等29个字段,用于实时分析车站客流情况,帮助乘客规划出行和优化运营管理。数据集通过算法模型计算客流比例和断面流量,支持地铁APP图形化展示拥挤度。
以上内容由遇见数据集搜集并总结生成


