泛北极工程活动范围冻土分布(2000-2015)
收藏国家青藏高原科学数据中心2022-08-08 更新2024-03-01 收录
下载链接:
https://data.tpdc.ac.cn/zh-hans/data/b3baaf14-d396-4235-a326-b003fd7b23ec
下载链接
链接失效反馈官方服务:
资源简介:
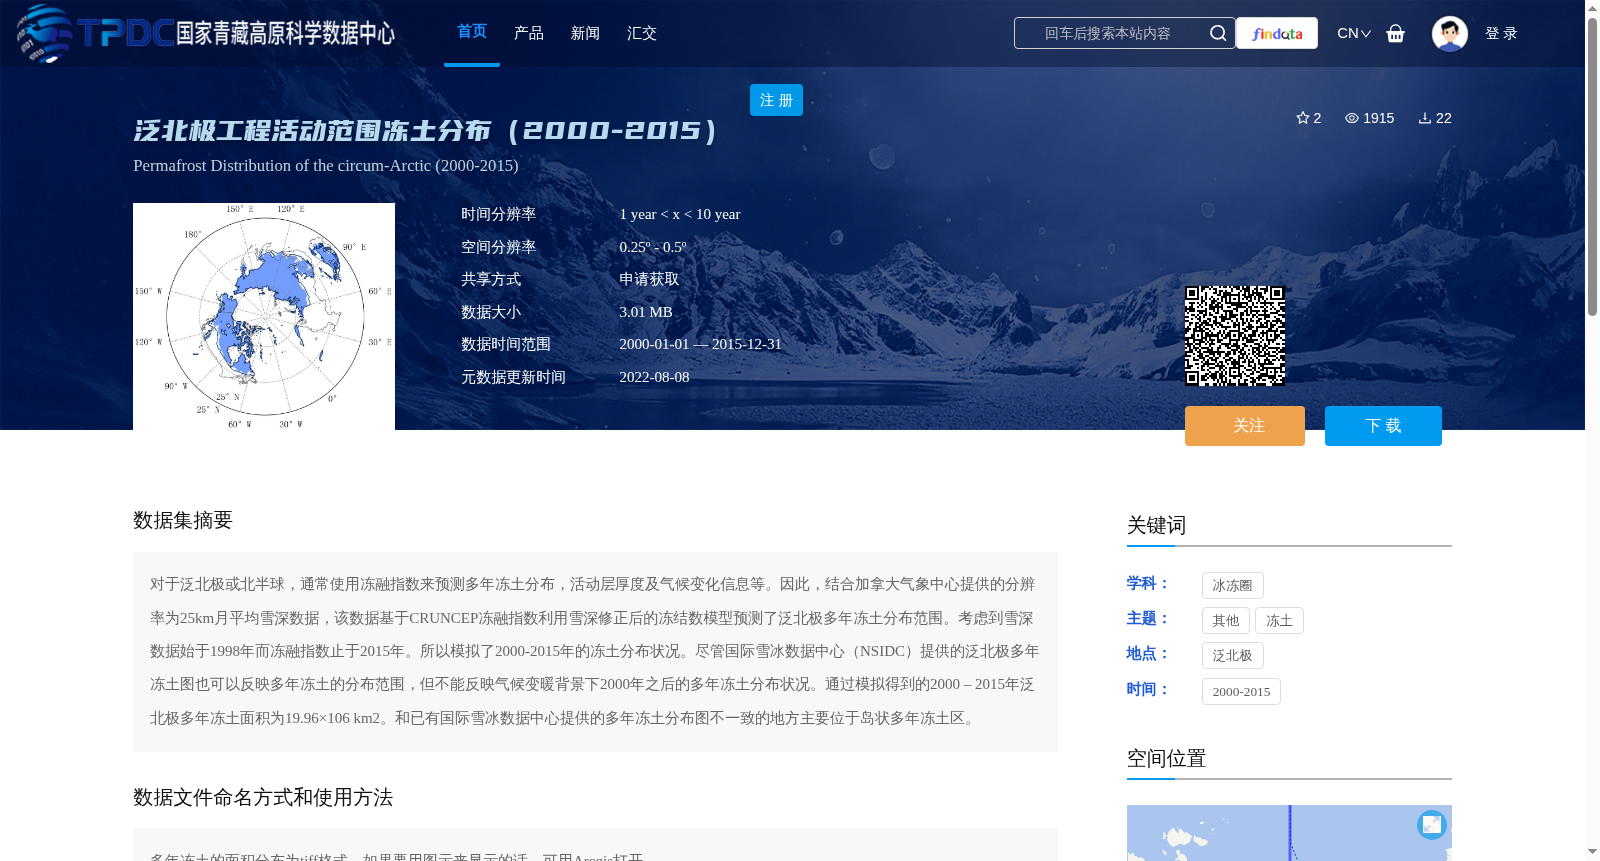
对于泛北极或北半球,通常使用冻融指数来预测多年冻土分布,活动层厚度及气候变化信息等。因此,结合加拿大气象中心提供的分辨率为25km月平均雪深数据,该数据基于CRUNCEP冻融指数利用雪深修正后的冻结数模型预测了泛北极多年冻土分布范围。考虑到雪深数据始于1998年而冻融指数止于2015年。所以模拟了2000-2015年的冻土分布状况。尽管国际雪冰数据中心(NSIDC)提供的泛北极多年冻土图也可以反映多年冻土的分布范围,但不能反映气候变暖背景下2000年之后的多年冻土分布状况。通过模拟得到的2000 – 2015年泛北极多年冻土面积为19.96×10⁶ km2。和已有国际雪冰数据中心提供的多年冻土分布图不一致的地方主要位于岛状多年冻土区。
In the Pan-Arctic region or the Northern Hemisphere, the freeze-thaw index is commonly utilized to forecast permafrost distribution, active layer thickness, climate change-related information and other relevant parameters. Leveraging the 25 km resolution monthly average snow depth data provided by the Canadian Meteorological Centre, this study employs the CRUNCEP-based freeze-thaw index and a snow depth-corrected freezing number model to predict the Pan-Arctic permafrost distribution extent. Given that the snow depth dataset begins in 1998 while the freeze-thaw index data terminates in 2015, the permafrost distribution conditions from 2000 to 2015 are simulated herein. Although the Pan-Arctic permafrost map provided by the National Snow and Ice Data Center (NSIDC) can reflect the general distribution range of permafrost, it fails to reflect the changes in permafrost distribution after 2000 under the background of climate warming. The simulated Pan-Arctic permafrost area from 2000 to 2015 is 19.96 × 10^6 km². The areas where this simulated result differs from the existing permafrost distribution map provided by NSIDC are mainly concentrated in the discontinuous permafrost regions.
提供机构:
牛富俊
创建时间:
2022-07-31
搜集汇总
数据集介绍
背景与挑战
背景概述
该数据集提供了2000-2015年泛北极地区工程活动范围内的冻土分布情况,基于冻融指数和雪深数据模拟生成,空间分辨率为0.25º - 0.5º。数据集主要用于研究气候变化背景下的冻土分布变化,模拟结果显示泛北极多年冻土面积为19.96×10⁶ km2。
以上内容由遇见数据集搜集并总结生成


