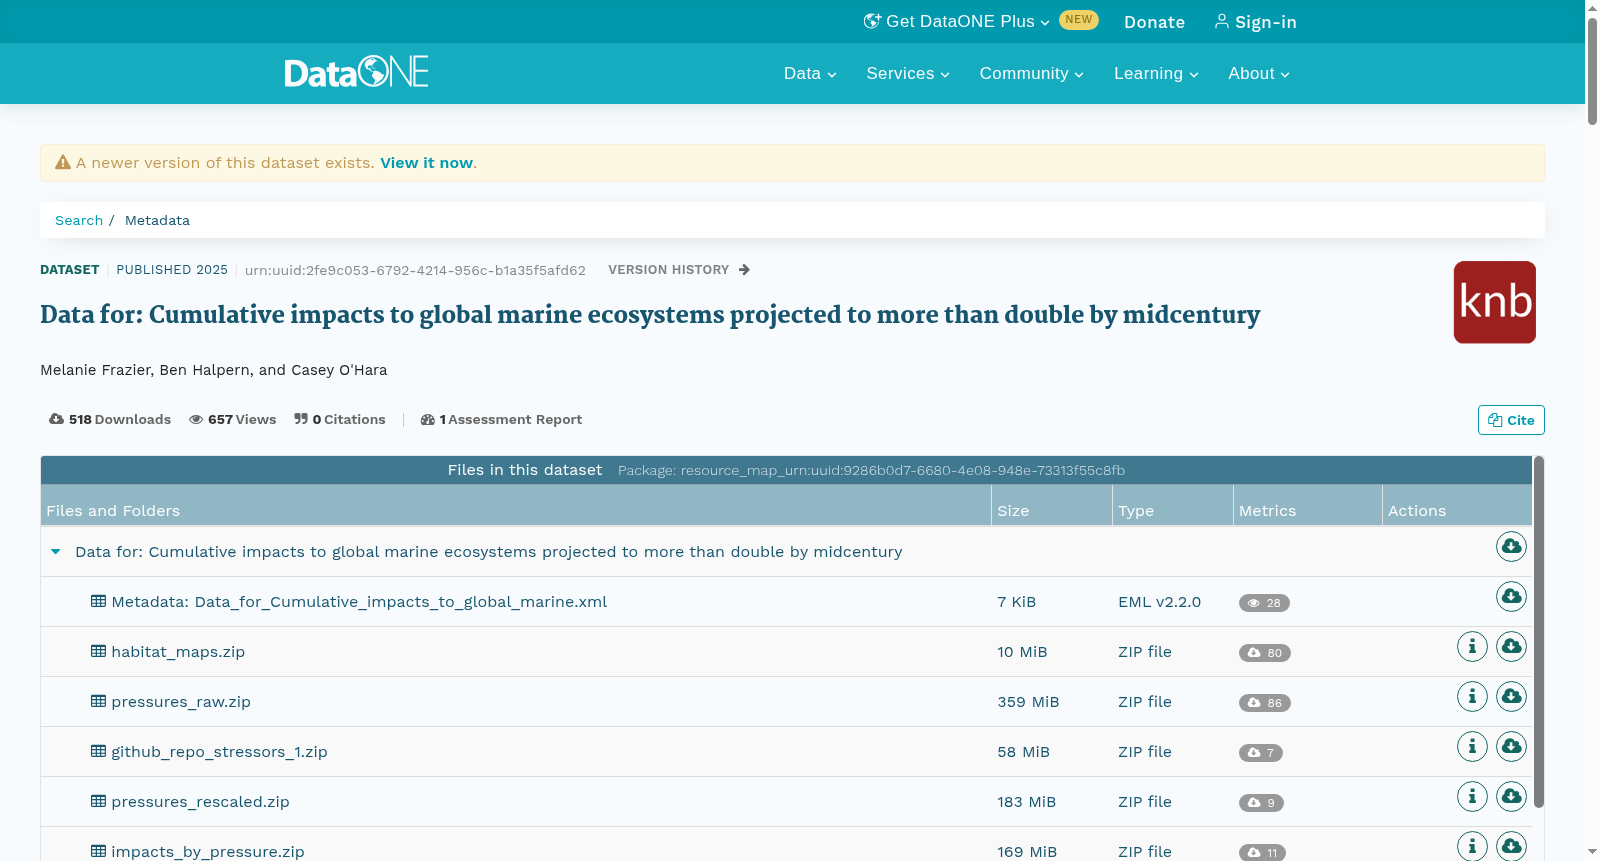
Data for: Cumulative impacts to global marine ecosystems projected to more than double by midcentury
收藏DataONE2025-04-12 更新2025-04-26 收录
下载链接:
https://search.dataone.org/view/urn:uuid:2fe9c053-6792-4214-956c-b1a35f5afd62
下载链接
链接失效反馈官方服务:
资源简介:
We estimate how future human pressures will impact marine ecosystems with the most comprehensive data sets available of mapped current extent and future projections for ten anthropogenic pressures. Pressure data cover six categories, including climate (water temperature; air heat-index; sea level rise), ocean chemistry (ocean acidification; dissolved oxygen), pollution (nutrient input; light), net primary productivity (NPP), disturbance (coastal human population density), and fisheries (fisheries biomass loss). We mapped pressure data at 10 km resolution for both current (roughly 2010-2020) and future (typically 2041-2060, or midcentury) pressure intensities, with focus on the SSP2-4.5 and SSP5-8.5 scenarios. We estimate how these pressures will impact marine habitats based on their overlap with current distributions of 20 marine habitats and the unique vulnerability of each habitat to each pressure, averaging the cumulative impact across habitats per pixel. The SSP2-4.5, “Middle of the road” scenario approximates current climate policy, whereas the SSP5-8.5, “Fossil-fueled development” is considered an “extreme counterfactual scenario” in which CO2 emissions double by midcentury. All raster data are 10 km resolution, in Mollweide Coordinate Reference system. We include several zipped files of data: (1) github_repo_stressors-1.zip is the contents of the GitHub repository that includes R scripts and data used for all calculations; (2) habitat_maps includes 20 .tif files of the habitat data used in the analysis and metadata; (3) pressures_raw includes 60 .tif files of raw (i.e., unscaled) pressure data and metadata; (4) pressures_rescaled includes 48 .tif files of rescaled pressure data (the raw heat index files get collapsed when rescaling) with values all between 0 (no pressure) and 1 (highest pressure), and metadata; (5) impacts_by_pressure includes 40 .tif files that describe the cumulative impact for each pressure across all habitats, at this step, the surface and benthic oxygen as well as the surface temperature and benthic temperature data are combined into a single pressure layers (i.e., reduced-oxygen and ocean-warming); (6) cumulative_impact includes 4 files describing the cumulative impact averaged across all habitats within each pixel.
本研究借助当前最全面的数据集,针对10项人为活动压力因子,绘制了其当前分布范围与未来预估结果,以此量化未来人类活动压力对海洋生态系统的影响。压力数据涵盖六大类别,分别为气候因子(水温、大气热指数、海平面上升)、海洋化学因子(海洋酸化、溶解氧)、污染因子(营养盐输入、光照)、净初级生产力(NPP)、干扰因子(沿海人口密度)以及渔业因子(渔业生物量损失)。本研究以10千米的空间分辨率绘制了当前(大致为2010-2020年)与未来(通常为2041-2060年,即本世纪中期)的压力强度数据,重点关注共享社会经济路径(Shared Socioeconomic Pathways, SSP)2-4.5与SSP5-8.5两种情景。本研究基于各压力因子与20种海洋生境当前分布的重叠情况,以及每种生境对各类压力因子的独特脆弱性,估算上述压力对海洋生境的影响,并对每个栅格内所有生境的累积影响取平均值。其中SSP2-4.5情景为"中间路线",其与当前气候政策大致相符;而SSP5-8.5情景即"化石燃料驱动发展",被视为"极端反事实情景",该情景下到本世纪中期二氧化碳排放量将翻倍。所有栅格数据均为10千米空间分辨率,采用莫尔韦德坐标系(Mollweide Coordinate Reference System)。本数据集包含如下多个压缩数据文件:(1) github_repo_stressors-1.zip:包含本研究所有计算所用的R脚本与相关数据的GitHub仓库内容;(2) habitat_maps:包含分析所用的20个.tif文件的生境数据及元数据;(3) pressures_raw:包含60个原始(即未标准化)压力因子数据.tif文件及元数据;(4) pressures_rescaled:包含48个经标准化后的压力因子数据.tif文件及元数据,标准化过程中原热指数文件将被合并,标准化后的数据取值范围均为0(无压力)至1(最高压力);(5) impacts_by_pressure:包含40个.tif文件,用于描述各类压力因子在所有生境下的累积影响;此步骤中,表层与底栖溶解氧数据,以及表层与底栖水温数据将被分别合并为单一压力图层,即低氧与海洋变暖图层;(6) cumulative_impact:包含4个文件,用于描述每个栅格内所有生境的平均累积影响。
创建时间:
2025-04-12
搜集汇总
数据集介绍
以上内容由遇见数据集搜集并总结生成


