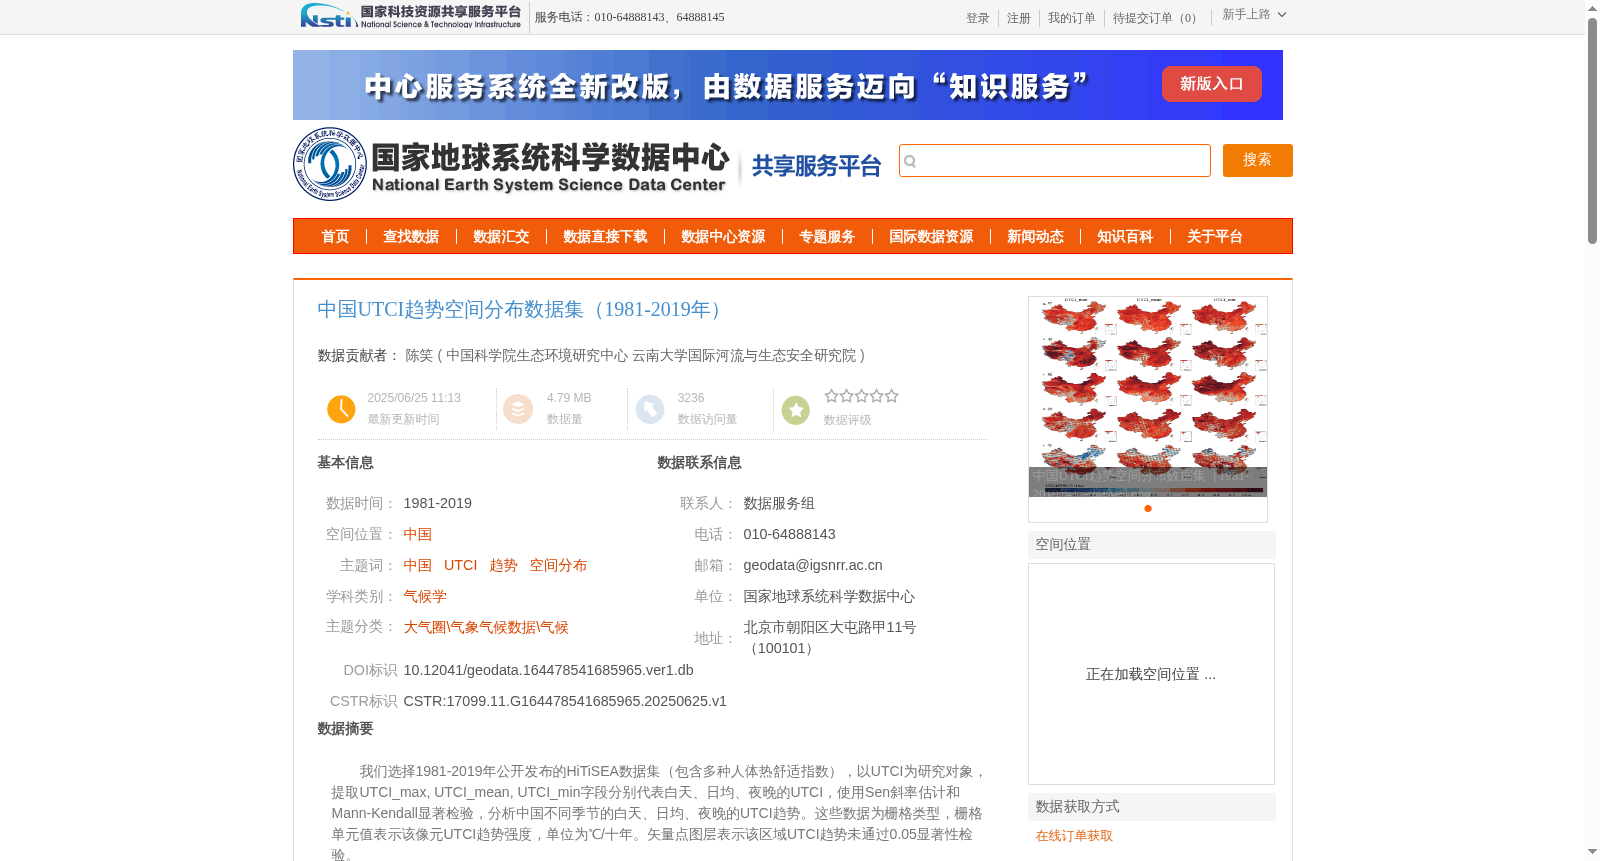
中国UTCI趋势空间分布数据集(1981-2019年)
收藏国家地球系统科学数据中心2025-06-25 更新2025-12-20 收录
下载链接:
https://www.geodata.cn/data/datadetails.html?dataguid=164478541685965&docId=1110
下载链接
链接失效反馈官方服务:
资源简介:
我们选择1981-2019年公开发布的HiTiSEA数据集(包含多种人体热舒适指数),以UTCI为研究对象,提取UTCI_max, UTCI_mean, UTCI_min字段分别代表白天、日均、夜晚的UTCI,使用Sen斜率估计和Mann-Kendall显著检验,分析中国不同季节的白天、日均、夜晚的UTCI趋势。这些数据为栅格类型,栅格单元值表示该像元UTCI趋势强度,单位为℃/十年。矢量点图层表示该区域UTCI趋势未通过0.05显著性检验。
We selected the publicly available HiTiSEA dataset (covering multiple human thermal comfort indices) released from 1981 to 2019. Focusing on UTCI, we extracted the fields UTCI_max, UTCI_mean, and UTCI_min to represent daytime, daily average, and nighttime UTCI respectively. Sen's slope estimation and Mann-Kendall significance test were employed to analyze the UTCI trends of daytime, daily average, and nighttime in different seasons across China. These data are stored in raster format, where the value of each raster cell denotes the UTCI trend intensity of the corresponding pixel, with the unit of ℃/decade. The vector point layer indicates that the UTCI trend in the corresponding region failed to pass the 0.05 significance test.
提供机构:
中国科学院生态环境研究中心 云南大学国际河流与生态安全研究院
创建时间:
2025-06-25
搜集汇总
数据集介绍
背景与挑战
背景概述
该数据集提供了1981-2019年中国UTCI趋势的空间分布,包括白天、日均和夜晚的UTCI变化趋势,数据以栅格格式呈现,单位为℃/十年,适用于气候学和气象气候研究。
以上内容由遇见数据集搜集并总结生成


