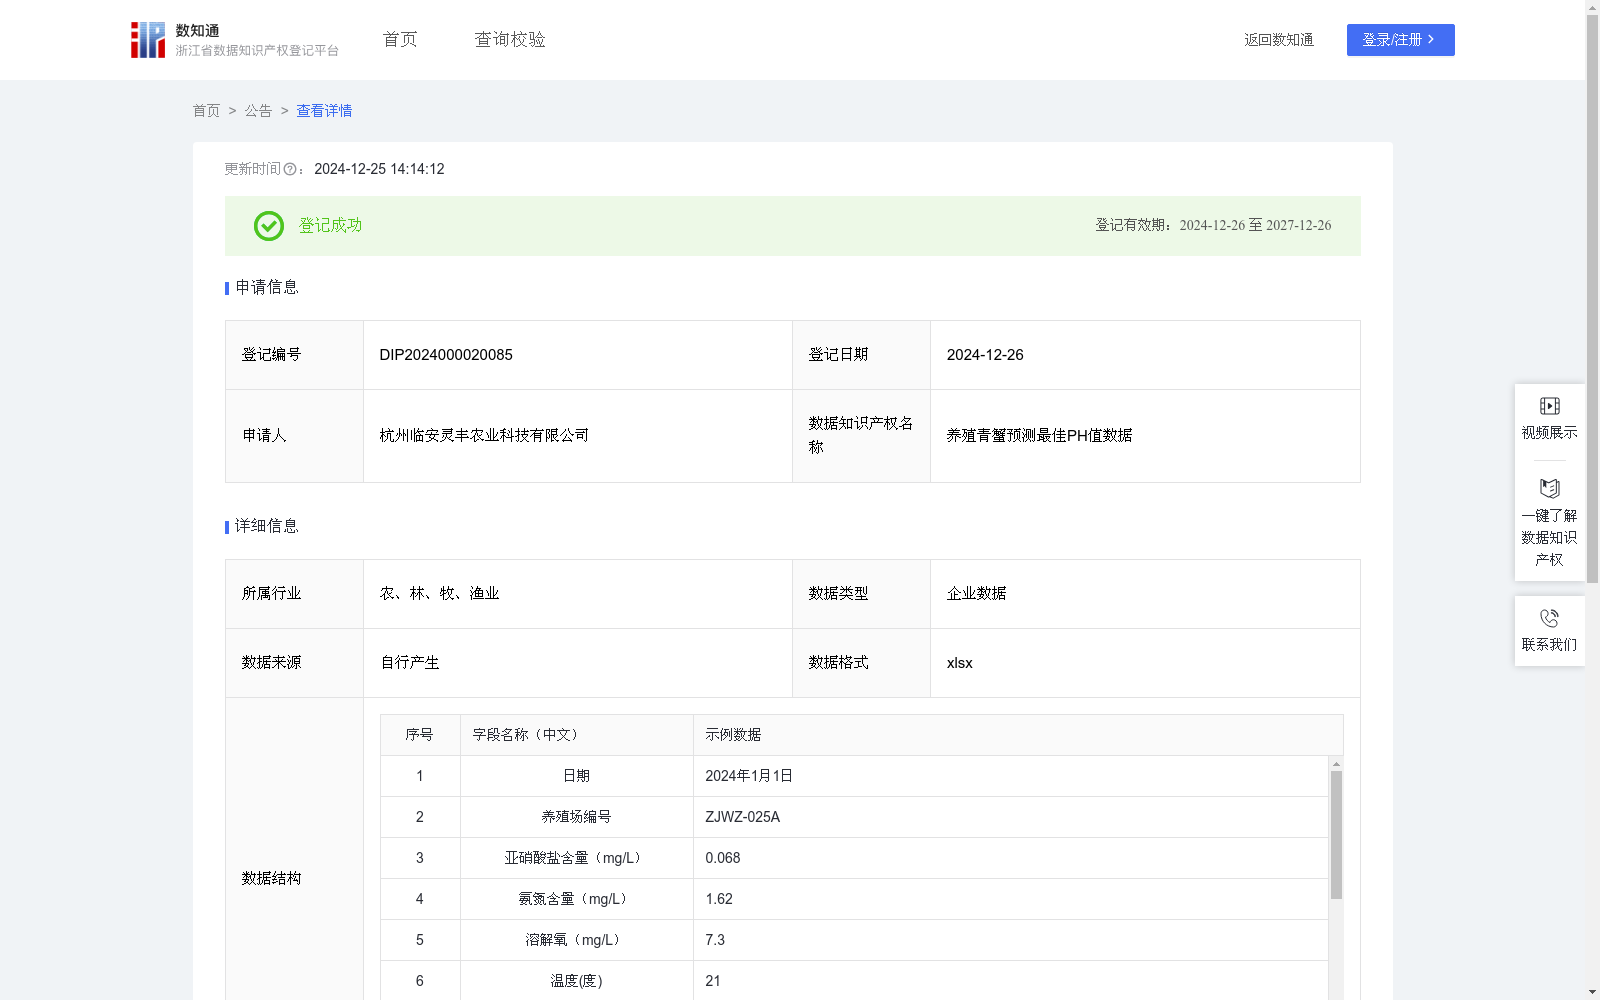
养殖青蟹预测最佳PH值数据
收藏浙江省数据知识产权登记平台2024-12-25 更新2024-12-26 收录
下载链接:
https://www.zjip.org.cn/home/announce/trends/108441
下载链接
链接失效反馈官方服务:
资源简介:
将采集到的数据用来整理分析青蟹养殖过程中的最佳PH值。在检测周期等数据为固定量条件下,调整养殖过程中的PH值,监测品质优化情形下数据的变化,以研究优化品质时的PH值数值,从而优化养殖方式,改进养殖环境方法,同时可将优化经验应用于外部环境,形成青蟹养殖环境的多维度感知与控制,促进养殖产业向科学、高效、模式可移植的方向发展。为广大的青蟹养殖企业提高了产品质量和生产效率提供技术支持。针对不同的养殖场将采集到的数据使用方差来预测青蟹养殖的最佳PH值。该模型在检测周期,养殖环境内氨氮含量,亚硝酸盐含量,溶解氧,温度等数据为固定数值范围的条件下,收集每天三个时刻青蟹养殖过程中的PH值,利用VAR函数计算三个PH值的方差大小,对比方差不同时,青蟹整体品质的变化,品种外观提升则记为﹢,下降记为-;品种健康状况提升则记为﹢,下降记为-;将两项整合,出现共同提升则整体品质预测记为“↑”,共同下降则整体品质预测记为“↓”,出现一上升一下降情形时,整体品质预测记为“/"。通过收集PH值数据及其方差情况对整体品质的影响,确认青蟹养殖提质情形下PH值的最佳数据范围,反推生产政策,从而为青蟹养殖乃至水产养殖等其他行业提供品质优化的技术数据支持。
The collected data are used to analyze and determine the optimal pH value during mud crab aquaculture. With the detection cycle and other fixed parameters, the pH value during aquaculture is adjusted, and the data changes under the scenario of quality optimization are monitored to study the optimal pH value for quality improvement, so as to optimize aquaculture methods and improve aquaculture environment management practices. Meanwhile, the optimized experience can be applied to external environments, enabling multi-dimensional perception and control of mud crab aquaculture environments, and promoting the aquaculture industry to develop toward a scientific, efficient, and mode-transplantable direction. This provides technical support for mud crab farming enterprises to enhance product quality and production efficiency. For various aquaculture farms, the collected data are utilized to predict the optimal pH value for mud crab aquaculture via variance analysis. Under the condition that the detection cycle, ammonia nitrogen content, nitrite content, dissolved oxygen, temperature and other aquaculture environment parameters are within fixed numerical ranges, the pH values during mud crab aquaculture are collected at three time points daily. The VAR function is employed to calculate the variance of the three collected pH values, and the changes in the overall quality of mud crabs are compared across different variance levels. An improvement in crab appearance is marked as "+", and a decline as "-". An improvement in crab health status is marked as "+", and a decline as "-". By integrating these two indicators, the overall quality prediction is marked as "↑" when both indicators improve, "↓" when both decline, and "/" when one indicator rises while the other falls. By collecting pH data and the impact of their variance on overall crab quality, the optimal pH range for improving mud crab aquaculture quality is determined, and corresponding production strategies are back-derived, thereby providing technical data support for quality optimization in mud crab aquaculture and even other aquaculture-related industries.
提供机构:
杭州临安灵丰农业科技有限公司
创建时间:
2024-12-04
搜集汇总
数据集介绍
特点
该数据集记录了养殖青蟹过程中的多项环境指标,主要用于通过方差分析预测最佳PH值,以优化养殖方式和环境,提高产品质量和生产效率。
以上内容由遇见数据集搜集并总结生成


