全程耦合框架下中国虚拟水贸易关联数据
收藏国家地球系统科学数据中心2025-03-28 更新2025-01-25 收录
下载链接:
https://www.geodata.cn/data/datadetails.html?dataguid=105091426386316&docId=1770
下载链接
链接失效反馈官方服务:
资源简介:
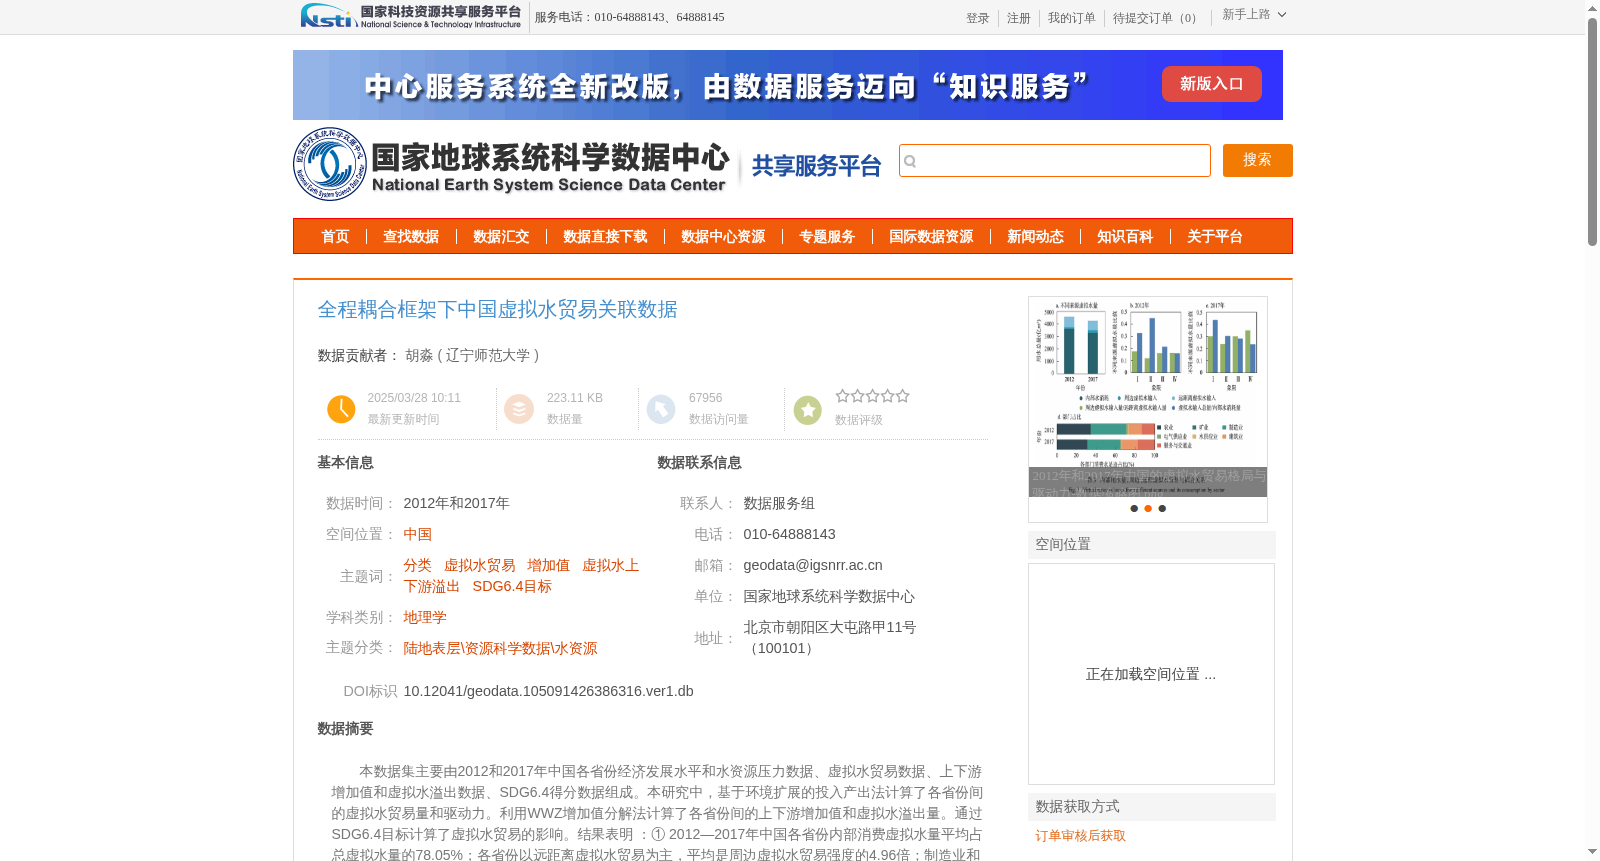
本数据集主要由2012和2017年中国各省份经济发展水平和水资源压力数据、虚拟水贸易数据、上下游增加值和虚拟水溢出数据、SDG6.4得分数据组成。本研究中,基于环境扩展的投入产出法计算了各省份间的虚拟水贸易量和驱动力。利用WWZ增加值分解法计算了各省份间的上下游增加值和虚拟水溢出量。通过SDG6.4目标计算了虚拟水贸易的影响。结果表明 :① 2012—2017年中国各省份内部消费虚拟水量平均占总虚拟水量的78.05%;各省份以远距离虚拟水贸易为主,平均是周边虚拟水贸易强度的4.96倍;制造业和农业所消费的虚拟水最多;与外溢系统相关的上游和下游虚拟水溢出量呈增多趋势,平均占总贸易虚拟水量的46.28%;江苏和吉林产生了最多的上游虚拟水溢出,新疆和黑龙江产生了最多的下游虚拟水溢出。③ 2017年上游虚拟水溢出最大的驱动力为制造业和建筑业,下游为制造业和农业;远距离贸易产生了较多的上游和下游虚拟水溢出。④ 虚拟水贸易使中国SDG 6.4目标的实现提升5.75%,远距离贸易产生的贡献高于周边贸易;虚拟水贸易最有利于缓解经济发达水资源禀赋差的省份用水压力,但对部分经济非发达省份产生了负面影响。
This dataset mainly comprises data on economic development levels and water stress, virtual water trade, inter-provincial upstream and downstream value-added and virtual water spillover, and SDG 6.4 scores of China’s provinces in 2012 and 2017. In this study, the volume and driving forces of inter-provincial virtual water trade were calculated based on the Environmentally Extended Input-Output (EEIO) method. The inter-provincial upstream and downstream value-added and virtual water spillover volumes were estimated using the WWZ value-added decomposition method. The impacts of virtual water trade were evaluated against the SDG 6.4 target. The results are as follows: ① From 2012 to 2017, the average share of virtual water consumed within individual provinces in China’s total virtual water volume was 78.05%; inter-provincial virtual water trade is dominated by long-distance trade, with an average intensity 4.96 times that of neighboring virtual water trade; the manufacturing and agricultural sectors account for the largest virtual water consumption; the volumes of upstream and downstream virtual water spillover associated with spillover networks show an upward trend, averaging 46.28% of total traded virtual water; Jiangsu and Jilin generated the maximum upstream virtual water spillover, while Xinjiang and Heilongjiang generated the maximum downstream virtual water spillover. ③ In 2017, the primary driving forces for upstream virtual water spillover were the manufacturing and construction sectors, while those for downstream spillover were the manufacturing and agricultural sectors; long-distance trade generates substantial upstream and downstream virtual water spillover. ④ Virtual water trade increases China’s progress toward achieving the SDG 6.4 target by 5.75%, with long-distance trade contributing more than neighboring trade; virtual water trade most effectively alleviates water stress in economically developed provinces with poor water resource endowments, but exerts negative impacts on some less economically developed provinces.
提供机构:
辽宁师范大学
创建时间:
2025-01-20
搜集汇总
数据集介绍
背景与挑战
背景概述
该数据集包含2012年和2017年中国各省份的虚拟水贸易相关数据,通过投入产出法和增加值分解法计算得出,揭示了虚拟水贸易的格局、驱动力及其对可持续发展目标的影响。数据来源于《中国统计年鉴》、《中国水资源公报》等官方资料,具有较高的权威性和研究价值。
以上内容由遇见数据集搜集并总结生成


