
Global Innovation Index
收藏opendatasoft2022-12-13 更新2024-05-31 收录
下载链接:
https://data.opendatasoft.com/explore/dataset/global-innovation-index-2015@kapsarc/table/
下载链接
链接失效反馈官方服务:
资源简介:
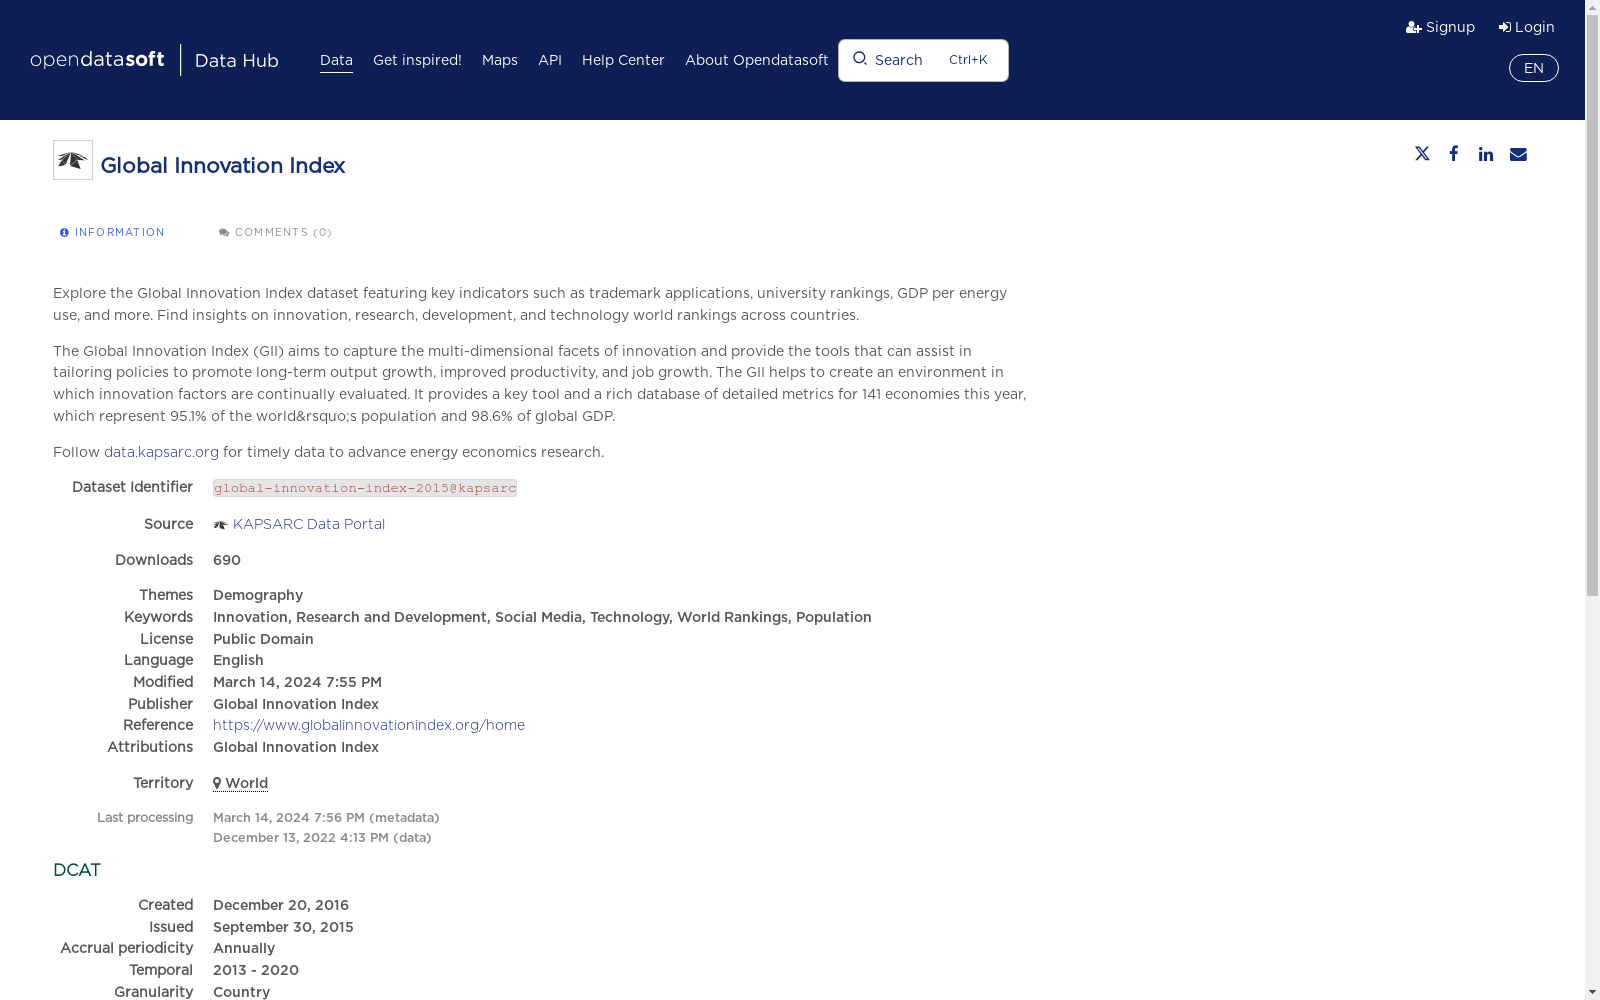
Explore the Global Innovation Index dataset featuring key indicators such as trademark applications, university rankings, GDP per energy use, and more. Find insights on innovation, research, development, and technology world rankings across countries.
Trademark application class count by origin, QS university ranking average score top 3 universities, GDP per unit of energy use, Domestic credit to private sector, Human capital and research, Venture capital deals, School life expectancy, Regulatory quality, Industrial designs by origin, ICT services exports, Gross capital formation, Ease of getting credit, Females employed with advanced degrees, Market capitalization, Growth rate of GDP per person engaged, ICT services imports, Political and operational stability, National feature films produced, State of cluster development, Business sophistication, Pupil-teacher ratio, secondary, Rule of law, Printing, publications & other media output, Global Innovation Index, Foreign direct investment, net outflows, ICTs and organizational model creation, Intellectual property payments, Government's online service, Ease of resolving insolvency, Intellectual property receipts, Trade, competition, & market scale, ISO 9001 quality certificates, Tertiary level inbound mobility, Environmental performance, GERD financed by business enterprise, New business density, Employment in knowledge-intensive services, Market sophistication, Innovation linkages, Tertiary enrolment, Cost of redundancy dismissal, Political environment, Online creativity, Global brand value, top 5000, Business environment, General infrastructure, Credit, Knowledge diffusion, Creative outputs, Intangible assets, Microfinance institutions' gross loan portfolio, Total computer software spending, Citable documents H index, Patent families filed in at least two offices, Innovation Output Sub-index, Creative goods exports, Wikipedia yearly edits, Electricity output, Knowledge absorption, Infrastructure, Gross expenditure on R&D (GERD), Country-code top-level domains (ccTLDs), High-tech imports, Applied tariff rate, weighted mean, GERD financed by abroad, Scientific and technical publications, Joint venture/strategic alliance deals, ICT use, Foreign direct investment, net inflows, High-tech and medium high-tech output, Graduates in science and engineering, Assessment in reading, mathematics, and science, Education, Research and development (R&D), PCT international applications by origin, Institutions, Logistics performance, GERD performed by business enterprise, ISO 14001 environmental certificates, Government effectiveness, Research talent in business enterprise, Cultural and creative services exports, Entertainment and media market, Information and communication technologies (ICTs), Utility model applications by origin, Patent applications by origin, Researchers, Ease of protecting minority investors, Creative goods and services, Ease of starting a business, Generic top-level domains (gTLDs), Expenditure on education, Tertiary education, Knowledge workers, Knowledge impact, Knowledge creation, Innovation Input Sub-index, Firms offering formal training, Domestic market scale, Global R&D companies, top 3, High-tech exports, ICT access, Knowledge and technology outputs, Ecological sustainability, Government funding per secondary student, Online e-participation, Investment, Intensity of local competition, Regulatory environment, University/industry research collaboration, Mobile app creation, Innovation Efficiency Ratio, PPP$ GDP, , 2005 PPP$ per kg, % GDP, Years, %, per million, per thousand, kWh/cap, FTE/mn pop, PPP$, US$, % GDP/cap, Score, Rank, Value, Score, 100=Max strength 0=Weakest, Rank=1, Best Innovation performance, Innovation, Research and Development, Social Media, Technology, World Rankings, Population
Afghanistan, Albania, Algeria, Andorra, Angola, Antigua and Barbuda, Argentina, Armenia, Australia, Austria, Azerbaijan, Bahamas, Bahrain, Bangladesh, Barbados, Belarus, Belgium, Belize, Benin, Bhutan, Bolivia, Bosnia and Herzegovina, Botswana, Brazil, Brunei, Bulgaria, Burkina Faso, Burundi, Cote d'Ivoire, Cabo Verde, Cambodia, Cameroon, Canada, Central African Republic, Chad, Chile, China, Colombia, Comoros, Congo, Costa Rica, Croatia, Cuba, Cyprus, Denmark, Djibouti, Dominica, Dominican Republic, Ecuador, Egypt, El Salvador, Equatorial Guinea, Eritrea, Estonia, Ethiopia, Fiji, Finland, France, Gabon, Gambia, Georgia, Germany, Ghana, Greece, Grenada, Guatemala, Guinea, Guyana, Haiti, Holy See, Honduras, Hungary, Iceland, India, Indonesia, Iran, Iraq, Ireland, Israel, Italy, Jamaica, Japan, Jordan, Kazakhstan, Kenya, Kiribati, Kuwait, Kyrgyzstan, Latvia, Lebanon, Lesotho, Liberia, Libya, Liechtenstein, Lithuania, Luxembourg, Madagascar, Malawi, Malaysia, Maldives, Mali, Malta, Marshall Islands, Mauritania, Mauritius, Mexico, Micronesia, Moldova, Monaco, Mongolia, Montenegro, Morocco, Mozambique, Myanmar, Namibia, Nauru, Nepal, Netherlands, New Zealand, Nicaragua, Niger, Nigeria, North Macedonia, Norway, Oman, Pakistan, Palau, Panama, Papua New Guinea, Paraguay, Peru, Philippines, Poland, Portugal, Qatar, Romania, Russia, Rwanda, Saint Kitts and Nevis, Saint Lucia, Saint Vincent and the Grenadines, Samoa, San Marino, Sao Tome and Principe, Saudi Arabia, Senegal, Serbia, Seychelles, Sierra Leone, Singapore, Slovakia, Slovenia, Solomon Islands, Somalia, South Africa, South Sudan, Spain, Sri Lanka, Sudan, Suriname, Sweden, Switzerland, Syria, Tajikistan, Tanzania, Thailand, Timor-Leste, Togo, Tonga, Trinidad and Tobago, Tunisia, Turkey, Turkmenistan, Tuvalu, Uganda, Ukraine, United Arab Emirates, United Kingdom, United States of America, Uruguay, Uzbekistan, Vanuatu, Venezuela, Yemen, Zambia, Zimbabwe
The Global Innovation Index (GII) aims to capture the multi-dimensional facets of innovation and provide the tools that can assist in tailoring policies to promote long-term output growth, improved productivity, and job growth. The GII helps to create an environment in which innovation factors are continually evaluated. It provides a key tool and a rich database of detailed metrics for 141 economies this year, which represent 95.1% of the world’s population and 98.6% of global GDP.
Follow data.kapsarc.org for timely data to advance energy economics research.
提供机构:
Global Innovation Index
创建时间:
2016-12-20
搜集汇总
数据集介绍
构建方式
全球创新指数(Global Innovation Index)数据集的构建基于对全球多个国家和地区的创新能力进行综合评估。该数据集汇集了来自世界知识产权组织(WIPO)、康奈尔大学和欧洲工商管理学院(INSEAD)等多方权威机构的数据,涵盖了创新投入、创新产出、创新环境等多个维度。通过定量分析和定性评估相结合的方法,数据集构建者对各国的创新表现进行了系统性的排名和评分,确保了数据集的科学性和权威性。
使用方法
全球创新指数数据集可广泛应用于学术研究、政策分析和企业战略制定。研究者可以利用该数据集进行跨国比较,探索创新驱动经济增长的机制。政策制定者则可以参考数据集中的排名和评分,制定针对性的创新政策,提升国家或地区的创新能力。企业可以通过分析数据集中的创新环境和产出指标,识别市场机会,优化创新战略。此外,教育机构也可以利用该数据集,设计创新教育项目,培养创新人才。
背景与挑战
背景概述
全球创新指数(Global Innovation Index, GII)是由康奈尔大学、欧洲工商管理学院和世界知识产权组织共同开发的一个综合性数据集,旨在评估全球各国和地区的创新能力。自2007年首次发布以来,GII已成为衡量创新绩效的重要工具,涵盖了从研发投入、教育水平到知识产权保护等多个维度。该数据集的核心研究问题是如何量化和比较不同国家和地区的创新能力,从而为政策制定者提供科学依据,推动全球创新生态系统的优化和发展。
当前挑战
尽管GII在评估全球创新能力方面取得了显著成就,但其构建过程中仍面临诸多挑战。首先,创新是一个多维度的复杂现象,涵盖了经济、社会、文化等多个层面,如何全面且准确地量化这些维度是一个重大挑战。其次,数据的可获得性和质量问题也限制了GII的精确性,特别是在一些发展中国家和地区,数据收集和统计体系尚不完善。此外,GII的指标体系需要不断更新以反映全球创新趋势的变化,这要求研究团队持续进行方法论的改进和创新。
发展历史
创建时间与更新
Global Innovation Index(GII)由康奈尔大学、欧洲工商管理学院和世界知识产权组织于2007年首次发布,旨在评估全球各国的创新能力。该指数每年更新一次,最新版本通常在每年7月发布。
重要里程碑
GII的创建标志着全球创新评估进入了一个新的阶段,它不仅提供了对各国创新能力的量化评估,还促进了国际间的创新合作与竞争。2010年,GII首次引入了创新集群的概念,进一步深化了对区域创新生态系统的理解。2015年,GII增加了对可持续发展目标(SDGs)的关注,强调了创新在实现全球可持续发展中的关键作用。
当前发展情况
当前,GII已成为全球创新政策制定者和研究者的重要参考工具,其影响力遍及全球。GII不仅提供了对各国创新表现的全面评估,还通过不断更新和扩展其指标体系,反映了全球创新趋势的变化。近年来,GII开始关注新兴技术如人工智能和区块链对创新的影响,进一步提升了其在科技前沿领域的指导意义。GII的发展不仅推动了全球创新生态系统的优化,也为各国制定创新战略提供了宝贵的数据支持。
发展历程
- 首次发布全球创新指数(Global Innovation Index),由康奈尔大学、欧洲工商管理学院和世界知识产权组织共同编制,旨在评估全球各经济体的创新能力。
- 全球创新指数首次引入“创新质量”指标,以衡量创新成果的实际影响力和应用价值。
- 全球创新指数报告首次发布“创新集群”分析,探讨全球创新活动的地理分布和集群效应。
- 全球创新指数报告首次引入“创新生态系统”概念,强调创新活动的系统性和协同性。
- 全球创新指数报告首次纳入“可持续发展目标”相关指标,强调创新在实现全球可持续发展中的作用。
常用场景
经典使用场景
在全球创新领域,Global Innovation Index(GII)数据集被广泛用于评估和比较各国在创新能力方面的表现。该数据集通过综合多个维度的指标,如研发投入、知识产权、高等教育和市场成熟度等,为政策制定者、学者和企业提供了详尽的创新能力分析。其经典使用场景包括国家间的创新能力排名、创新政策的制定与评估,以及跨国企业的市场进入策略分析。
解决学术问题
GII数据集解决了全球创新研究中的多个关键学术问题。首先,它为学者提供了一个系统化的框架,用于研究不同国家创新能力的差异及其背后的驱动因素。其次,通过长期跟踪和比较,GII数据集有助于揭示创新活动的动态变化,从而为创新理论的发展提供了实证支持。此外,该数据集还促进了跨学科研究,如经济学、管理学和公共政策等领域的交叉研究,推动了创新研究的深入发展。
实际应用
在实际应用中,GII数据集为全球范围内的创新政策制定提供了科学依据。政府机构利用该数据集评估本国的创新现状,识别优势与不足,进而制定针对性的创新战略。同时,跨国公司和投资者通过分析GII数据,可以更准确地评估目标市场的创新潜力,优化全球资源配置。此外,教育机构和研究组织也利用GII数据集进行创新教育与研究,培养创新人才,推动科技创新的持续进步。
数据集最近研究
最新研究方向
在全球创新指数(Global Innovation Index)的最新研究中,学者们聚焦于如何通过量化和分析全球各国的创新能力,以揭示创新驱动经济增长的内在机制。研究不仅关注传统的创新指标,如研发投入和专利数量,还扩展到新兴领域,如数字经济和绿色技术。通过构建多维度创新评价体系,研究者们旨在为政策制定者提供科学依据,以优化创新政策,促进全球经济的可持续发展。此外,该研究还探讨了全球创新网络的形成与演变,强调跨国合作在提升创新能力中的关键作用。
相关研究论文
- 1The Global Innovation Index 2021: Tracking Innovation through the COVID-19 CrisisWorld Intellectual Property Organization (WIPO) · 2021年
- 2Innovation and Economic Growth: Evidence from the Global Innovation IndexElsevier · 2020年
- 3The Role of Innovation in Economic Development: A Comparative Analysis Using the Global Innovation IndexTaylor & Francis Online · 2019年
- 4Innovation and Competitiveness: Insights from the Global Innovation IndexSpringer · 2020年
- 5The Global Innovation Index: Measuring Innovation Performance in a Global ContextWorld Bank · 2018年
以上内容由遇见数据集搜集并总结生成



