【我遇到的问题】 • 现象:该数据集的下载链接已失效 【相关信息】 • 可考虑访问这个链接获取类似文件~https://www.selectdataset.com/dataset/3688356173feccbcf1f1e490ddc6bc72
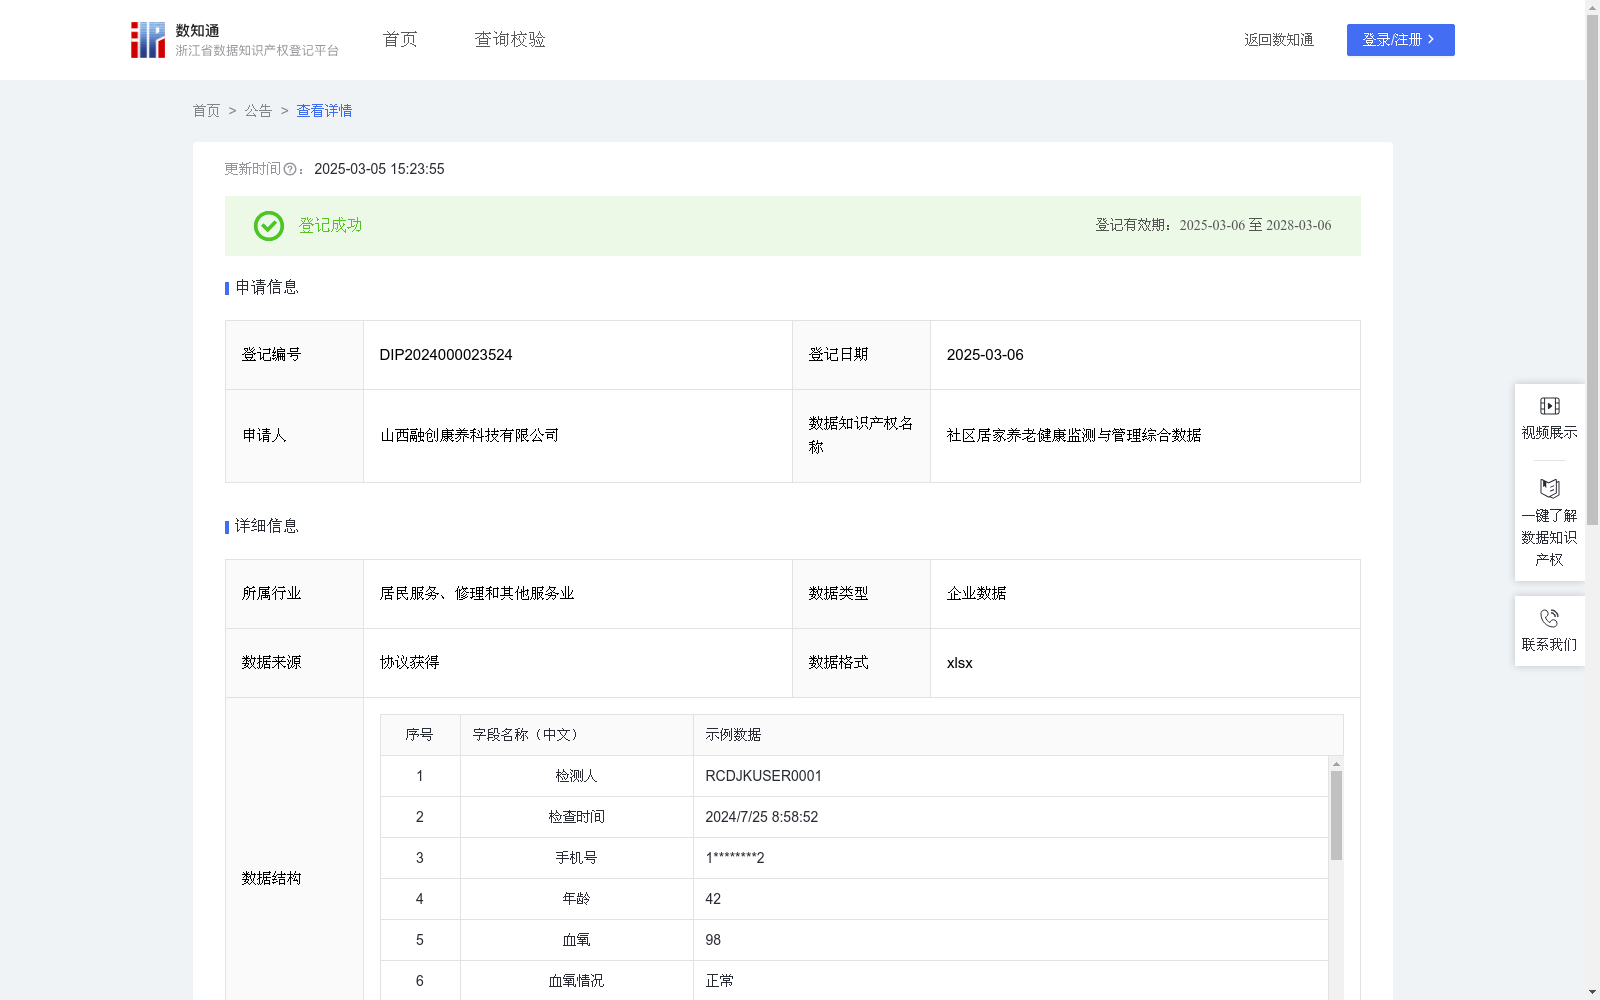
社区居家养老健康监测与管理综合数据
收藏浙江省数据知识产权登记平台2025-03-05 更新2025-03-06 收录
下载链接:
https://www.zjip.org.cn/home/announce/trends/115566
下载链接
链接失效反馈官方服务:
资源简介:
应用场景描述
“社区居家养老健康监测管理数据”项目专为提升中国老年人生活质量而设计,尤其针对在家中养老的长者。通过集成智能穿戴设备(如智能手环、血压计等)和移动互联网技术,系统能实时收集并分析老人的生命体征数据,提供远程健康监控服务。该方案不仅有助于及时发现潜在健康风险,还能促进医疗资源的有效配置和个人化健康管理。
适用条件
本系统适用于具备基本网络连接的社区环境,并要求用户同意合法的数据采集与使用协议。所有设备需符合国家信息安全标准,确保数据传输的安全性和隐私保护。
适用范围与对象
主要面向居住于社区内的老年居民,特别是患有慢性病或行动受限的长者。此外,还包括负责老人日常护理的家属及社区医疗服务人员。通过此平台,医护人员可获取实时健康报告,进行远程诊断;家属则能够随时掌握亲人的健康状态,增加心理上的安全感。1. 数据来源:通过智能健康监测设备(如智能手环、血压计、血糖仪等)自动采集老年人的生命体征数据,如血氧、心率、血压/舒张、血压/收缩、脉率、血糖、血尿酸、体温等基础信息。
2. 数据预处理
清洗:去除异常值、填补缺失值,确保数据准确性和完整性。
标准化:对不同来源的数据进行统一格式化处理,保证一致性。检测人用编号代替,如RCDJKUSER0001、RCDJKUSER0002……RCDJKUSER0840,
特征提取:根据原始数据分析数据值,并进行标注, 如血氧情况、心率情况、舒张压情况、收缩压情况、脉率情况、血糖情况等,参照正常值范围分别标记为正常、偏高、偏低,为后续分析提供基础。
3. 模型构建与应用
分类模型:采用逻辑回归算法输出健康风险,区分正常和异常两个状态。当所有监测指标均在标准范围内时,模型输出“正常”, 任一指标超出标准范围(偏高或偏低),模型输出“异常”。
预测模型:使用逻辑回归算法提前预警潜在风险,当某些指标接近但未超过临界值时,模型提示潜在风险,如血压变化异常,则潜在风险一项会提示“血压”,建议进一步观察或采取预防措施。当指标均趋于正常值,则潜在风险提示“无”。
4. 结果解释与反馈机制
可解释性:确保模型输出的结果易于理解和解释,使医生和家属能够根据建议采取适当行动
### Application Scenario Description
The "Community Home-based Elderly Care Health Monitoring and Management Data" project is specifically designed to improve the quality of life for elderly people in China, especially those who receive aging care at home. By integrating smart wearable devices (such as smart bracelets, blood pressure monitors, etc.) and mobile internet technologies, the system can collect and analyze vital sign data of the elderly in real time, providing remote health monitoring services. This solution not only helps detect potential health risks in a timely manner, but also promotes the effective allocation of medical resources and personalized health management.
### Applicable Conditions
This system is suitable for community environments with basic network connectivity, and requires users to consent to legal data collection and usage agreements. All devices must comply with national information security standards to ensure the security of data transmission and privacy protection.
### Scope and Target Audience
It is mainly targeted at elderly residents living in communities, especially those with chronic diseases or limited mobility. In addition, it also includes family members who are responsible for the daily care of the elderly and community medical service personnel. Through this platform, medical staff can obtain real-time health reports for remote diagnosis; family members can keep track of their loved ones' health status at any time, increasing psychological security.
1. Data Source
Vital sign data of the elderly, including basic information such as blood oxygen, heart rate, diastolic blood pressure, systolic blood pressure, pulse rate, blood glucose, blood uric acid, body temperature, etc., are automatically collected through smart health monitoring devices (such as smart bracelets, blood pressure monitors, blood glucose meters, etc.).
2. Data Preprocessing
Cleaning: Remove outliers and fill in missing values to ensure data accuracy and integrity.
Standardization: Perform unified formatting processing on data from different sources to ensure consistency. Replace human user IDs with uniform identifiers such as RCDJKUSER0001, RCDJKUSER0002……RCDJKUSER0840.
Feature Extraction: Analyze data values based on original data and perform labeling, such as blood oxygen status, heart rate status, diastolic blood pressure status, systolic blood pressure status, pulse rate status, blood glucose status, etc., which are marked as normal, high, or low according to the normal value range, providing a basis for subsequent analysis.
3. Model Construction and Application
Classification Model: Logistic regression algorithm is used to output health risks, distinguishing between normal and abnormal states. When all monitoring indicators are within the standard range, the model outputs "Normal"; if any indicator exceeds the standard range (high or low), the model outputs "Abnormal".
Prediction Model: Logistic regression algorithm is used to provide early warning of potential risks. When some indicators are close to but not exceeding the critical value, the model prompts potential risks. For example, if there is an abnormal change in blood pressure, the potential risk item will prompt "Blood Pressure", suggesting further observation or preventive measures. When all indicators tend to be normal, the potential risk prompt will be "None".
4. Result Interpretation and Feedback Mechanism
Interpretability: Ensure that the output results of the model are easy to understand and interpret, so that doctors and family members can take appropriate actions based on the recommendations.
提供机构:
山西融创康养科技有限公司
创建时间:
2024-12-18
搜集汇总
数据集介绍
以上内容由遇见数据集搜集并总结生成


