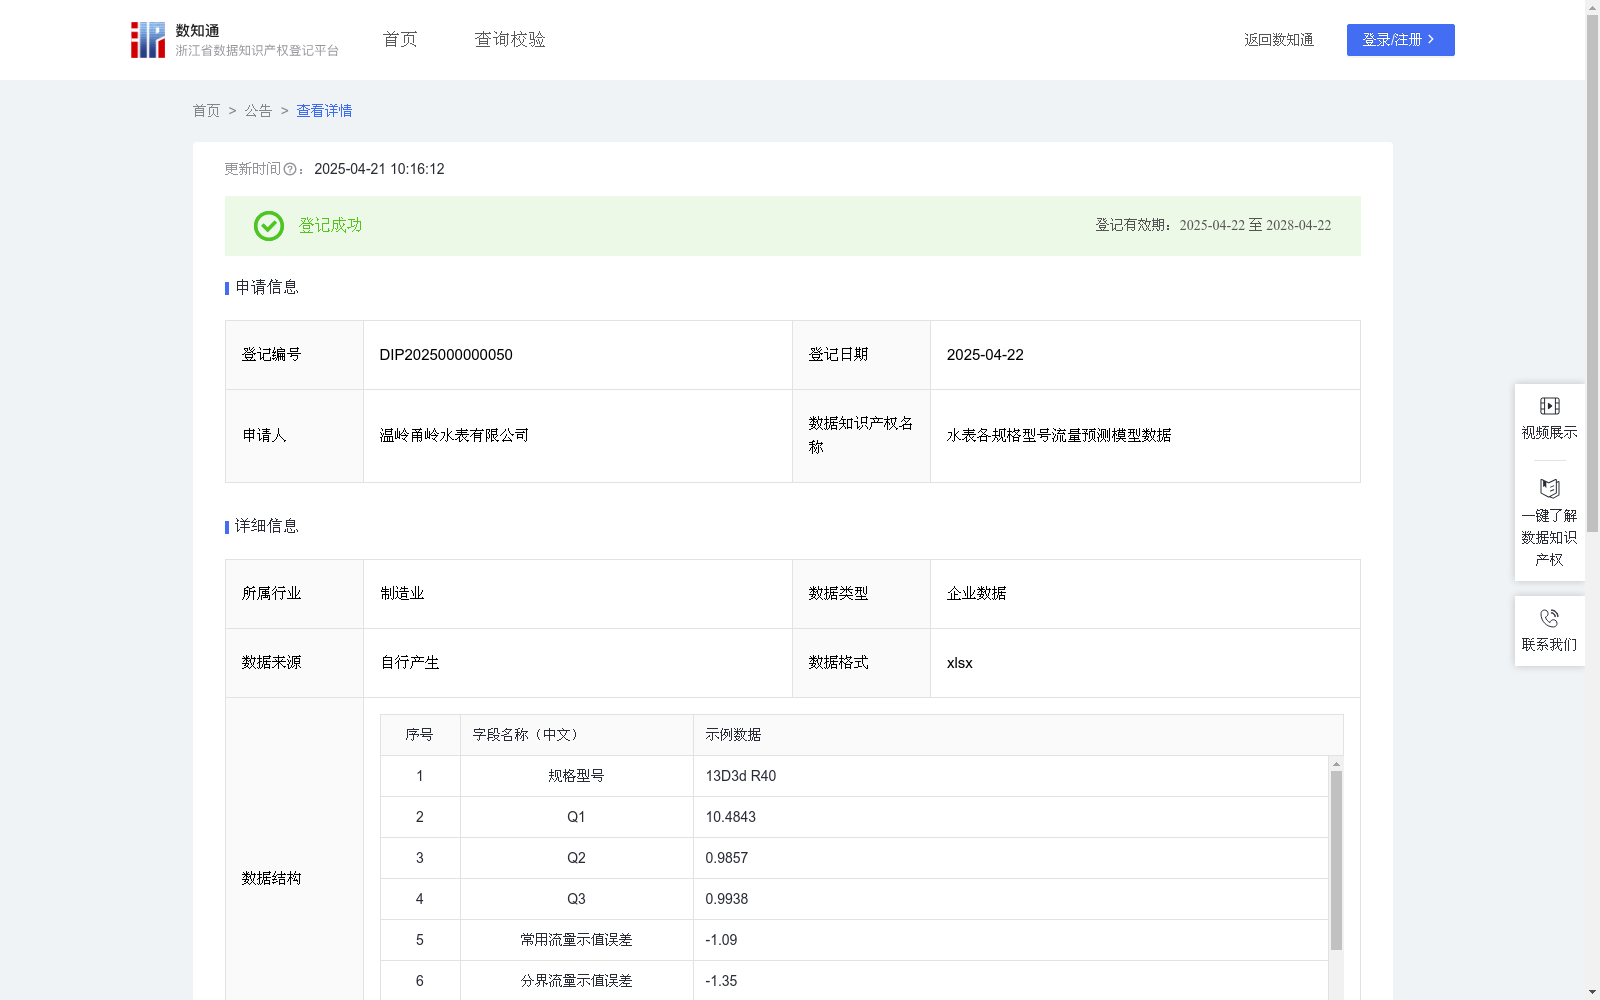
水表各规格型号流量预测模型数据
收藏浙江省数据知识产权登记平台2025-04-21 更新2025-04-22 收录
下载链接:
https://www.zjip.org.cn/home/announce/trends/124808
下载链接
链接失效反馈官方服务:
资源简介:
水表流量数据,通过RFID甬岭智能制造管理系统获取水表各规格型号、最小流量、分界流量、常用流量、各流量与标准值之间的偏差数据进行分析,应用场景如下:
1.流量数据和误差值是评估水表性能和准确性的重要指标。在生产过程中,这些数据可以用来监控水表的生产质量,确保产品符合规定的流量测量精度和误差要求。
2.通过对数据分析,生产工艺可以进行调整和优化,以提高水表的稳定性可靠性,从而提高产品质量和生产效率。
3.为客户选水表型号提供数据支撑。
4.通过不断收集和分析流量数据和误差值,生产企业可以找出产品存在的问题和不足,进而开展技术改进和创新。
5.验证水表产品是否符合法律法规和行业标准的要求,保证产品在市场上的合规性。
6.及时发现和排查生产设备或工艺上的故障,确保生产过程的稳定运行。基于RFID系统采集的各水表规格型号的原始校验记录,筛选清洗挑选出可用样本,筛选方式如下:1.进行异常值检测,排除可能由于设备故障或其他原因引起的异常数据。2.对于缺失的数据点,用标准值填充。3.根据季节性特征选择特定时间段的数据。4.确认测量设备的准确性和数据记录的完整性。
本算法计算规则:1.数据清洗、去除异常值和时间范围进行数据预处理。异常值检测:计算数据的四分位数Quar,定义异常值Outliers为低于Q1-1.5*Quar或高于Q3+1.5*Quar的数据。
2.Q1、Q2、Q3流量数据和误差值,作为算法的输入特征,用于计算正态分布的均值和标准差,并进行预测。误差计算公式:误差E1、E2、E3=(实际测量值Q1、Q2、Q3-标准值)/标准值。
3.利用计算得到的均值和标准差,应用正态分布的概率密度函数,根据给定的输入值,计算其在正态分布曲线下的概率密度值X。
4.根据具体的应用需求,设定适当的阈值Z,基于正态分布的概率密度值来判断是否超出限定范围或异常情况。如果计算得到的概率密度值低于某个预设的阈值,可能表示该数据点不符合正常的流量分布,因此这条产出的数据Data可以被视为异常,并标注状态State。
5.最后规格型号S的总体异常率=State为异常的数量/Date时间段内总生成的数量。
Water meter flow data is acquired via the RFID-based Yongling Intelligent Manufacturing Management System, which collects and analyzes data covering various specifications and models of water meters, minimum flow rate, transitional flow rate, conventional flow rate, and deviation data between each flow rate and the standard value. The application scenarios are as follows:
1. Flow data and error values are critical indicators for evaluating water meter performance and accuracy. During the production process, such data can be used to monitor the production quality of water meters, ensuring that products meet the specified flow measurement accuracy and error requirements.
2. Through data analysis, production processes can be adjusted and optimized to improve the stability and reliability of water meters, thereby enhancing product quality and production efficiency.
3. Provide data support for customers to select appropriate water meter models.
4. By continuously collecting and analyzing flow data and error values, production enterprises can identify existing problems and deficiencies in their products, and carry out technical improvements and innovations.
5. Verify whether water meter products comply with laws, regulations and industry standards, ensuring their market compliance.
6. Timely detect and troubleshoot faults in production equipment or processes, ensuring stable operation of the production process.
Based on the original verification records of various water meter specifications and models collected by the RFID system, available samples are screened and cleaned through the following methods:
1. Outlier detection: Exclude abnormal data possibly caused by equipment faults or other reasons.
2. Fill missing data points with standard values.
3. Select data from specific time periods based on seasonal characteristics.
4. Confirm the accuracy of measurement equipment and the integrity of data records.
The algorithm calculation rules are as follows:
1. Data preprocessing including data cleaning, outlier removal and time range screening. Outlier detection: Calculate the quartiles Quar of the data, and define outliers as data lower than Q1 - 1.5*Quar or higher than Q3 + 1.5*Quar.
2. Q1, Q2, Q3 flow data and error values are used as input features of the algorithm to calculate the mean and standard deviation of the normal distribution and perform prediction. The error calculation formula: Errors E1, E2, E3 = (actual measured values Q1, Q2, Q3 - standard value) / standard value.
3. Using the calculated mean and standard deviation, apply the probability density function of the normal distribution to calculate the probability density value X under the normal distribution curve based on a given input value.
4. Set an appropriate threshold Z according to specific application requirements, and determine whether it exceeds the limited range or abnormal conditions based on the probability density value of the normal distribution. If the calculated probability density value is lower than a preset threshold, it may indicate that the data point does not conform to the normal flow distribution, so the generated data can be regarded as abnormal and the state State can be marked.
5. Finally, the overall abnormal rate of specification model S = the number of data points marked as abnormal State / the total number of generated data within the Date time period.
提供机构:
温岭甬岭水表有限公司
创建时间:
2025-01-04
搜集汇总
数据集介绍
背景与挑战
背景概述
该数据集包含水表各规格型号的流量数据和误差值,用于监控生产质量、优化工艺和验证合规性,数据规模为20001条,每日更新。
以上内容由遇见数据集搜集并总结生成


