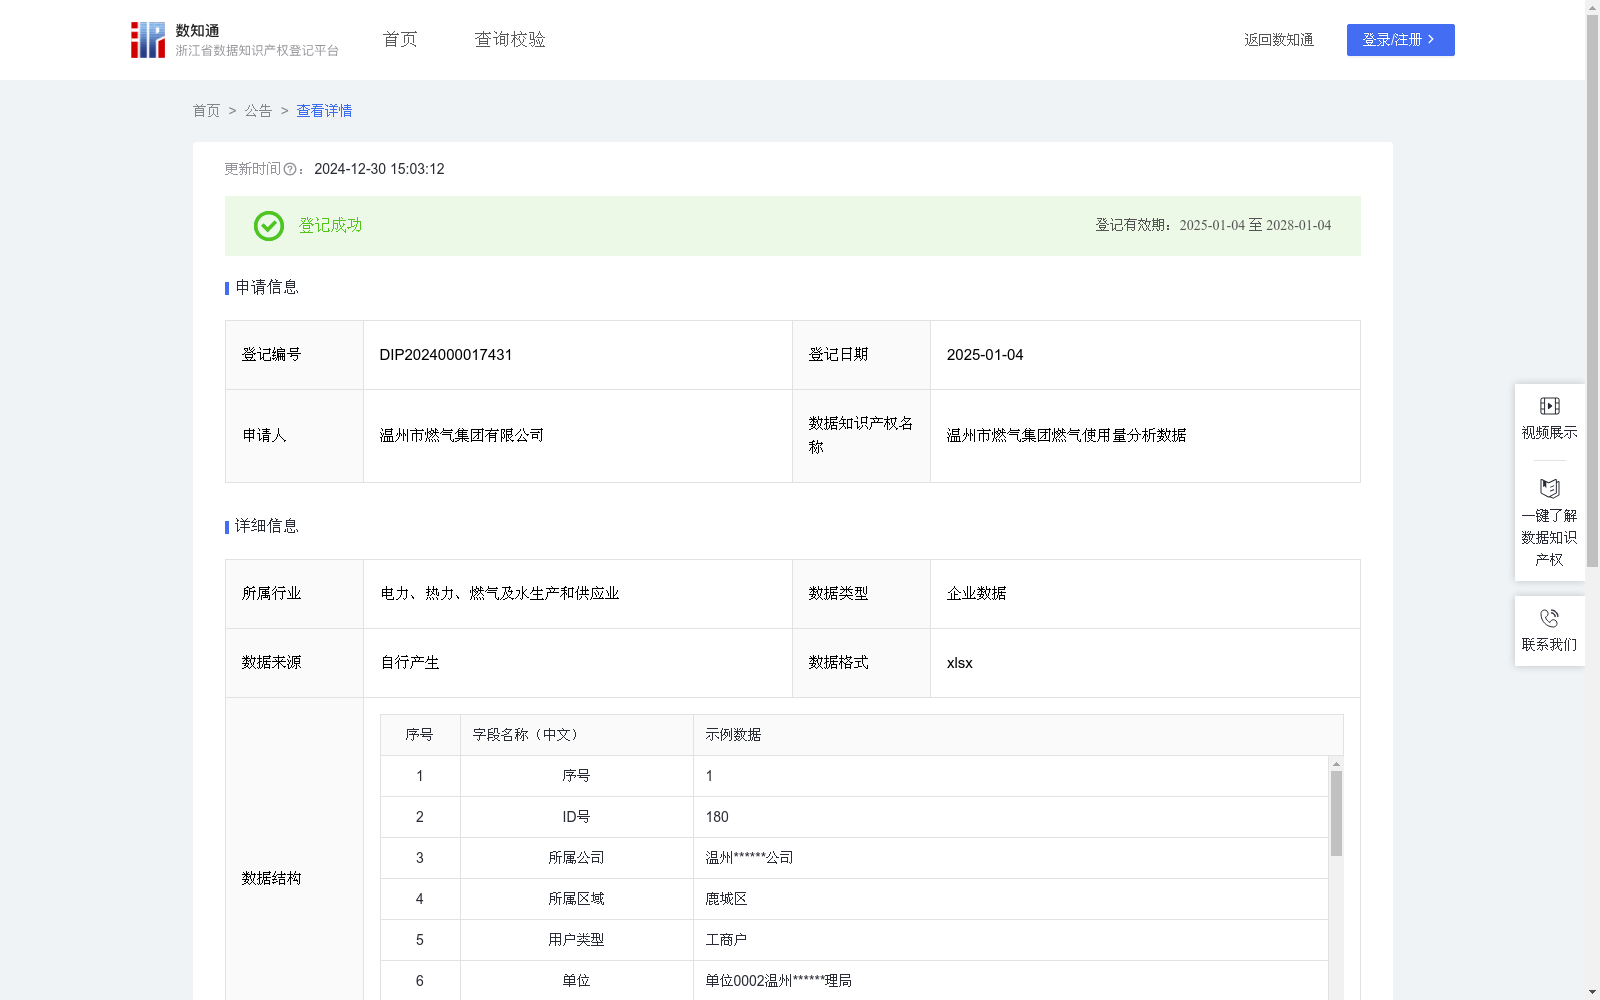
温州市燃气集团燃气使用量分析数据
收藏资源简介:
通过收集和分析地区燃气数据,优化燃气供应和管理的各个方面。首先,利用物联网技术,实时监测燃气管道压力、流量和用户用气情况,确保供气安全稳定。通过数据分析,预测用气高峰和低谷,优化燃气调度,减少资源浪费。此外,数据分析还帮助识别潜在的安全隐患,及时进行维护和检修,降低事故风险。利用用户用气数据,提供个性化的用气方案和建议,帮助用户优化用气习惯,降低用气成本。同时,数据分析支持市场分析和客户关系管理,提升服务质量。通过与政府和其他公共服务部门的合作,燃气数据还用于城市规划和能源政策制定,推动智慧城市建设。为了进一步优化企业运营,燃气公司可以利用数据分析来提升内部管理效率。通过分析用户用气数据与成本数据,识别成本节约的机会,优化采购和库存管理,降低运营成本。此外,数据分析还可以帮助公司进行市场趋势预测,制定更精准的营销策略,提高市场竞争力和客户满意度。三个月的平均增长量计算说明:[(月用量-月平均用量)/月用量 + (前第一个月的月用量-前第一个月的月平均用量)/前第一个月的月用量 + (前第二个月的月用量-前第二个月的月平均用量)/前第二个月的月用量]/3 *100。 年度增长量计算说明(2023年度起):(本年累计用量-去年累计用量)/ 本年累计用量 *100 。 行业对比用量计算说明:(本年累计用量-行业所属年平均用量)/本年累计用量*100。 价值系数=年度增长量*0.25 +三个月的平均增长量*0.5 +行业对比用量*0.25。
This dataset aims to optimize all aspects of natural gas supply and management through the collection and analysis of regional natural gas data. Firstly, Internet of Things (IoT) technologies are utilized to monitor the pressure, flow rate of natural gas pipelines and user gas consumption in real time, ensuring safe and stable gas supply. Through data analysis, peak and off-peak periods of gas consumption can be predicted, optimizing gas dispatching to reduce resource waste. Additionally, data analysis helps identify potential safety hazards, enabling timely maintenance and repair to lower accident risks. By leveraging user gas consumption data, personalized gas usage plans and suggestions are provided to help users optimize their consumption habits and reduce their gas costs. Meanwhile, data analysis supports market analysis and customer relationship management (CRM), thereby improving service quality. Through cooperation with government and other public service departments, natural gas data is also applied to urban planning and energy policy formulation, promoting the construction of smart cities. To further optimize enterprise operations, natural gas companies can use data analysis to enhance internal management efficiency. By analyzing user gas consumption data and cost data, opportunities for cost savings are identified, optimizing procurement and inventory management to reduce operating costs. Furthermore, data analysis can assist companies in forecasting market trends, formulating more precise marketing strategies, and enhancing market competitiveness and customer satisfaction. Explanation of 3-month average growth rate calculation: [(Monthly Consumption - Monthly Average Consumption)/Monthly Consumption + (Previous 1st Month's Monthly Consumption - Previous 1st Month's Monthly Average Consumption)/Previous 1st Month's Monthly Consumption + (Previous 2nd Month's Monthly Consumption - Previous 2nd Month's Monthly Average Consumption)/Previous 2nd Month's Monthly Consumption] /3 *100 Explanation of annual growth rate calculation (starting from 2023): (Current Year's Cumulative Consumption - Previous Year's Cumulative Consumption)/Current Year's Cumulative Consumption *100 Explanation of industry comparison consumption calculation: (Current Year's Cumulative Consumption - Annual Average Consumption of the Corresponding Industry)/Current Year's Cumulative Consumption *100 Value Coefficient = 0.25 * Annual Growth Rate + 0.5 * 3-month Average Growth Rate + 0.25 * Industry Comparison Consumption