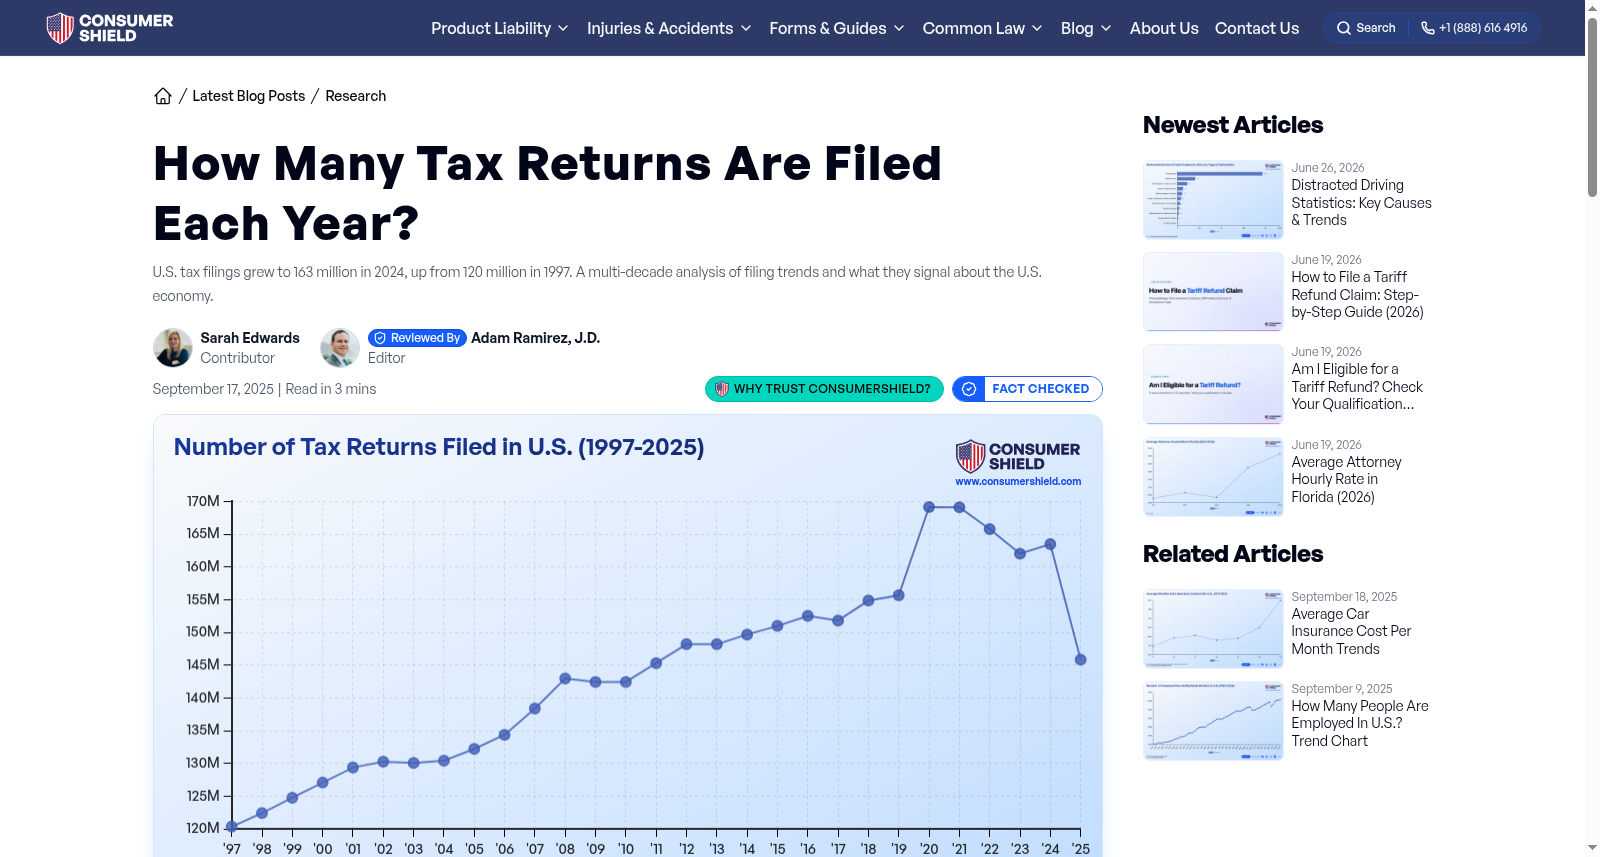
Number of Tax Returns Filed in U.S. (1997-2023)
收藏资源简介:
The graph illustrates the number of tax returns filed in the United States from 1997 to 2023. The x-axis represents the years, ranging from 1997 to 2023, while the y-axis denotes the number of tax returns filed, spanning from 120,351,208 in 1997 to a peak of 164,358,792 in 2021. Throughout this period, the number of tax returns filed generally increases, with the lowest figure recorded in 1997 and the highest in 2021. Notable fluctuations include a slight decline in 2010 and a decrease in 2022 compared to the previous year. Overall, the data exhibits a consistent upward trend in tax return filings over the 27-year span. This information is presented in a line graph format, effectively highlighting the annual changes and long-term growth in tax return submissions in the United States.
本图示描绘了美国自1997年至2023年间提交的税务申报数量。横轴代表年份,时间跨度为1997年至2023年,纵轴则表示提交的税务申报数量,从1997年的12,035,120,8个增至2021年的16,435,879,2个峰值。在此期间,税务申报数量总体呈上升趋势,最低值为1997年的记录,最高值为2021年的数据。其中值得关注的波动包括2010年略有下降,以及与上一年相比,2022年有所减少。总体来看,这27年的数据呈现出税务申报数量持续上升的稳定态势。此信息以折线图的形式呈现,有效地突显了美国税务申报提交的年度变化和长期增长趋势。