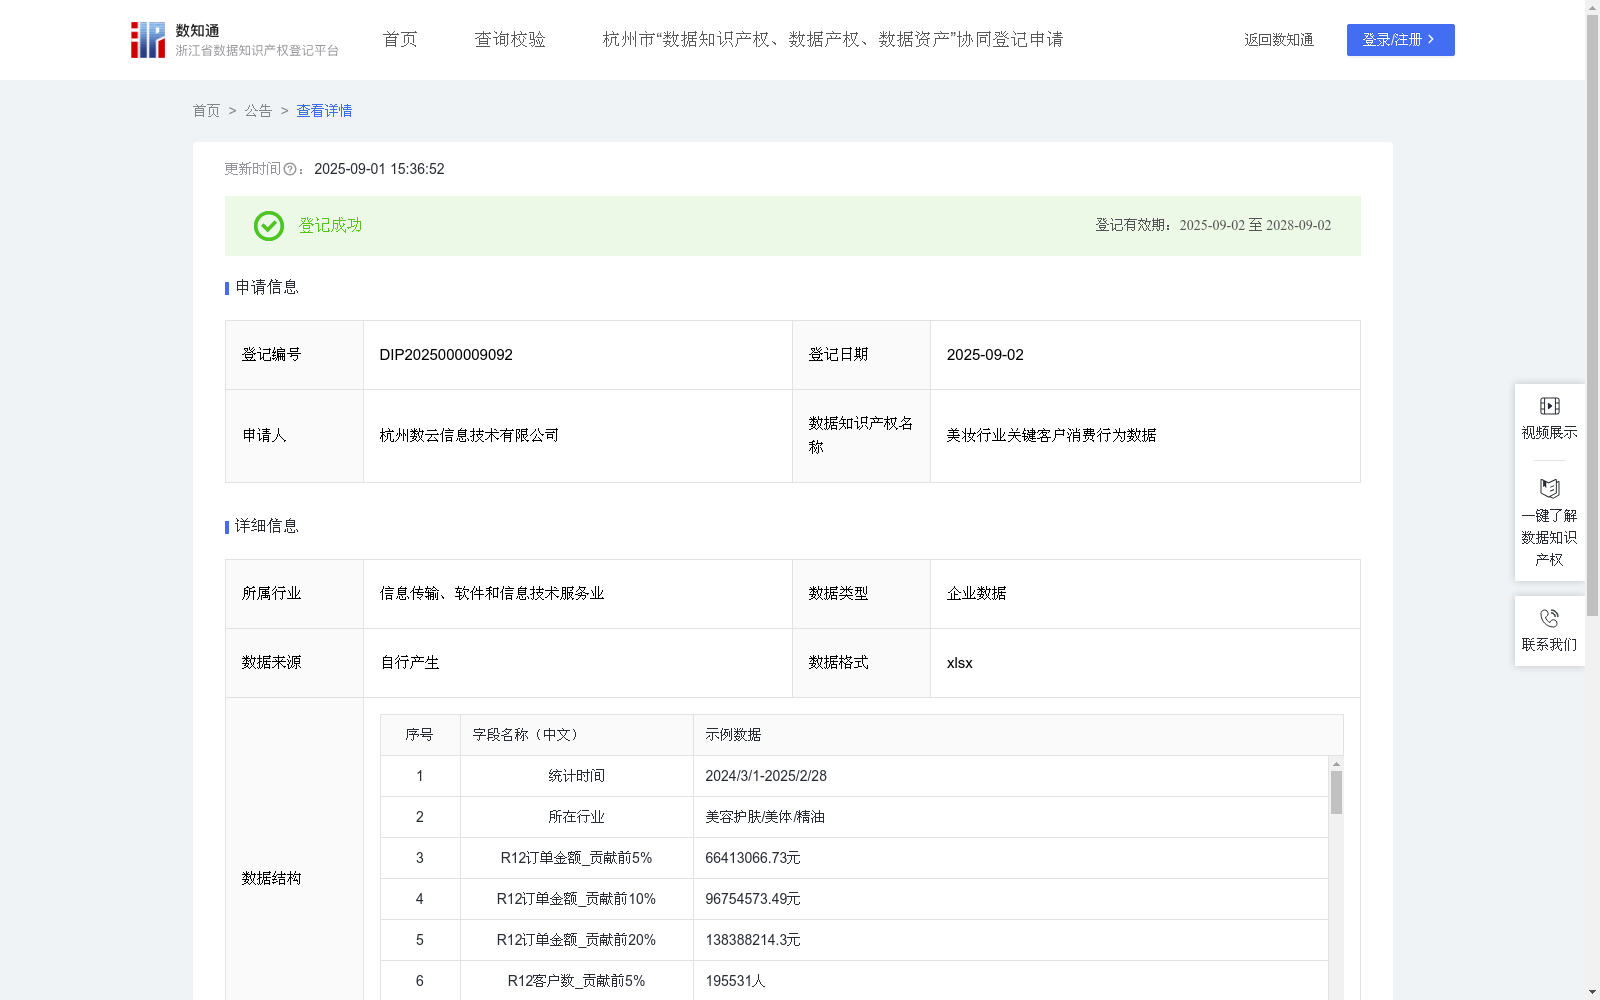
美妆行业关键客户消费行为数据
收藏浙江省数据知识产权登记平台2025-09-01 更新2025-09-06 收录
下载链接:
https://www.zjip.org.cn/home/announce/trends/173390
下载链接
链接失效反馈官方服务:
资源简介:
此数据通过对一定规模美妆行业关键客户消费行为的数据分析,帮助企业:1. 定位顶级VIP客户:通过前5%客户的人均购买金额和笔单价,识别消费能力最强的核心客户,提供专属服务。2. 消费力下降信号:若头部客户人均购买金额环比负增长,需排查原因,及时挽回。3. 过度依赖风险:前5%客户人均金额极高但频次低,反映依赖少数大单客户,需分散风险。
4.识别高价值客户,监控消费趋势,防范大客户依赖风险。
数据应用:
5.识别高价值客户,监控消费趋势,防范大客户依赖风险。数据采集:
通过数云自研CRM系统采集全渠道交易数据、会员数据并进行加工。获取数据完整进行加工,单位为元/笔/次。
数据加工:
1. 贡献前5%/10%/20%客户_人均购买金额=贡献前5%/10%/20%客户_销售金额 / 贡献前5%客户_客户数
2. 贡献前5%/10%/20%客户_人均购买频次=贡献前5%/10%/20%客户_交易数 / 贡献前5%客户_客户数
3. 贡献前5%/10%/20%客户_笔单价=贡献前5%/10%/20%客户_销售金额 / 贡献前5%客户_交易数
4. 环比增长=(R12指标-R13_24指标)/R13_24指标
This dataset is developed based on the analysis of consumer behavior data of key customers in the beauty industry at a certain scale, to assist enterprises in the following aspects:
1. Identify top-tier VIP customers: Identify core customers with the strongest spending power based on the per-capita purchase amount and average transaction value of the top 5% of customers, and provide exclusive services for them.
2. Early warning of declining spending power: If the per-capita purchase amount of top-tier customers shows month-on-month negative growth, investigate the underlying causes and take timely measures to retain these customers.
3. Over-reliance risk warning: If the per-capita purchase amount of the top 5% of customers is extremely high but the transaction frequency is low, it reflects over-reliance on a small number of large-order customers, and risk diversification is required.
4. Identify high-value customers, monitor consumption trends, and prevent the risk of over-reliance on large customers.
Data Application:
5. Identify high-value customers, monitor consumption trends, and prevent the risk of over-reliance on large customers.
Data Collection:
Collect and process omni-channel transaction data and membership data via Shuyun's self-developed CRM system. Complete data is collected and processed, with the unit being yuan per transaction per occurrence.
Data Processing:
1. Per-capita purchase amount of top 5%/10%/20% contributing customers = Total sales amount of top 5%/10%/20% contributing customers / Number of customers in the corresponding contributing customer group
2. Per-capita transaction frequency of top 5%/10%/20% contributing customers = Total transaction count of top 5%/10%/20% contributing customers / Number of customers in the corresponding contributing customer group
3. Average transaction value of top 5%/10%/20% contributing customers = Total sales amount of top 5%/10%/20% contributing customers / Total transaction count of the corresponding contributing customer group
4. Month-on-month growth = (R12 indicator - R13_24 indicator) / R13_24 indicator
提供机构:
杭州数云信息技术有限公司
创建时间:
2025-06-25
搜集汇总
数据集介绍
以上内容由遇见数据集搜集并总结生成


