祁连山综合观测网:兰州大学寒旱区科学观测网络(西营河站气象要素梯度观测系统-2018)
收藏地球大数据科学工程2024-03-04 收录
下载链接:
https://data.casearth.cn/sdo/detail/5feae826819aec33049b7ccb
下载链接
链接失效反馈官方服务:
资源简介:
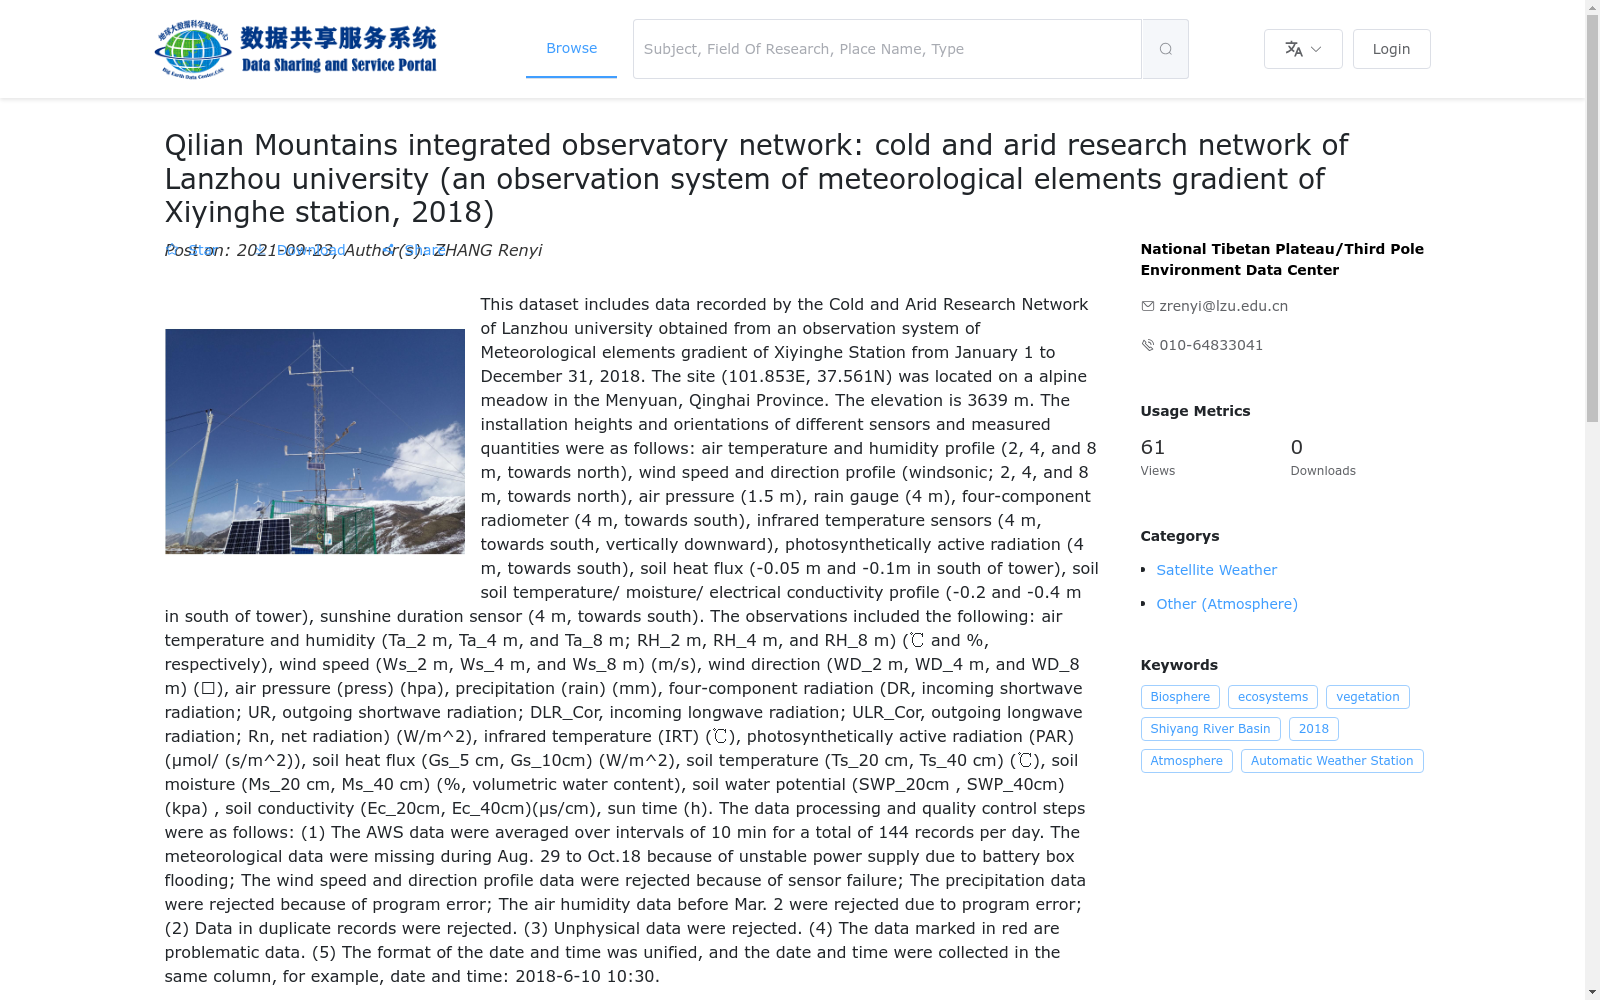
该数据集包含了2018年1月1日至2018年12月31日兰州大学兰州大学寒旱区科学观测网络西营河站气象要素梯度观测系统数据。站点位于青海海北门源县仙米乡讨拉村,下垫面是高寒草甸。观测点的经纬度是101.855E,37.561N,海拔3616m。二维超声风速/风向传感器和空气温湿度传感器分别架设在2m、4m、8m处,共3层,朝向正北;气压计安装在1.5m采集箱内;翻斗式雨量计安装在塔4m处;红外温度计安装在4m处,朝向正南,探头朝向垂直向下;土壤热通量板(自校正式)(2块)依次埋设在塔南侧植被下5cm和10cm处;土壤温/湿/电导率传感器和土壤水势传感器埋设在塔南侧植被下20cm和40cm处;光合有效辐射传感器、日照时数传感器以及四分量辐射仪安装在4m处,朝向正南。
观测项目有:风速(WS_2m、WS_4m、WS_8m)(单位:米/秒)、风向(WD_2m、WD_4m、WD_8m)(单位:度)、空气温湿度(Ta_2m、Ta_4m、Ta_8m和RH_2m、RH_4m、RH_8m)(单位:摄氏度、百分比)、气压(Press)(单位:百帕)、降水量(Rain)(单位:毫米)、四分量辐射(DR、UR、DLR_Cor、ULR_Cor、Rn)(单位:瓦/平方米)、地表辐射温度(IRT)(单位:摄氏度)、土壤热通量(Gs_5cm、Gs_10cm)(单位:瓦/平方米)、土壤水分(Ms_20cm、Ms_40cm)(单位:百分比)、土壤温度(Ts_20cm、Ts_40cm)(单位:摄氏度) 、土壤水势(SWP_20cm,SWP_40cm)(单位:千帕)、土壤电导率(EC_20cm、EC_40cm)(单位:微西门子/厘米)、光合有效辐射(PAR)(单位:微摩尔/平方米秒)、日照时数(Sun_time)(单位:小时)。
观测数据的处理与质量控制:(1)确保每天144个数据(每10min);2018.8.29-10.18由于电池箱进水导致的供电不稳定,气象数据丢失严重未入库;2018.10.18日起2m超声风速/风向传感器故障,该位置风速数据错误;雨量筒程序错误,全年数据无效;由于程序故障,2018.1.1-3.2空气湿度采集错误;(2)剔除有重复记录的时刻;(3)删除了明显超出物理意义或超出仪器量程的数据;(4)数据中以红字标示的部分为有疑问的数据;(5)日期和时间的格式统一,并且日期、时间在同一列。如,时间为:2018-6-10 10:30。
This dataset contains meteorological element gradient observation system data from the Xiying River Station of the Cold and Arid Regions Science Observation Network of Lanzhou University, covering the period from January 1, 2018 to December 31, 2018. The observation site is located in Taola Village, Xianmi Township, Menyuan County, Haibei, Qinghai, with an underlying surface of alpine meadow. Its geographic coordinates are 101.855°E, 37.561°N, and the elevation is 3616 m.
Two-dimensional ultrasonic wind speed/direction sensors and air temperature and humidity sensors were installed at heights of 2 m, 4 m, and 8 m respectively, with a total of 3 layers, facing due north. The barometer was installed in a 1.5 m-high acquisition box. The tipping-bucket rain gauge was installed at 4 m of the observation tower. The infrared thermometer was installed at 4 m, facing due south with the probe oriented vertically downward. Two self-calibrating soil heat flux plates were buried at 5 cm and 10 cm below the vegetation on the south side of the tower, respectively. Soil temperature, moisture and electrical conductivity sensors, as well as soil water potential sensors, were buried at 20 cm and 40 cm below the vegetation on the south side of the tower. The photosynthetically active radiation (PAR) sensor, sunshine duration sensor, and four-component radiometer were installed at 4 m, facing due south.
Observation items include:
- Wind speed (WS_2m, WS_4m, WS_8m) (unit: m/s)
- Wind direction (WD_2m, WD_4m, WD_8m) (unit: degree)
- Air temperature and humidity (Ta_2m, Ta_4m, Ta_8m and RH_2m, RH_4m, RH_8m) (unit: ℃, %)
- Atmospheric pressure (Press) (unit: hPa)
- Precipitation (Rain) (unit: mm)
- Four-component radiation (DR, UR, DLR_Cor, ULR_Cor, Rn) (unit: W/m²)
- Surface radiation temperature (IRT) (unit: ℃)
- Soil heat flux (Gs_5cm, Gs_10cm) (unit: W/m²)
- Soil moisture (Ms_20cm, Ms_40cm) (unit: %)
- Soil temperature (Ts_20cm, Ts_40cm) (unit: ℃)
- Soil water potential (SWP_20cm, SWP_40cm) (unit: kPa)
- Soil electrical conductivity (EC_20cm, EC_40cm) (unit: μS/cm)
- Photosynthetically active radiation (PAR) (unit: μmol/(m²·s))
- Sunshine duration (Sun_time) (unit: hour)
Data processing and quality control procedures are as follows:
1. Ensure 144 data records per day (one record every 10 minutes). Severe meteorological data loss occurred from August 29 to October 18, 2018 due to unstable power supply caused by water intrusion into the battery box, and such data was not stored in the database. Since October 18, 2018, the 2 m ultrasonic wind speed/direction sensor has malfunctioned, leading to incorrect wind speed data at this position. The rain gauge had program errors, making the annual precipitation data invalid. Air humidity collection errors occurred from January 1 to March 2, 2018 due to program faults.
2. Remove records with duplicate timestamps.
3. Delete data that obviously exceeds physical limits or instrument measurement ranges.
4. Data marked in red in the dataset indicates questionable records.
5. The date and time formats are unified, and date and time are stored in the same column. For example, the time format is: 2018-6-10 10:30.
提供机构:
国家青藏高原科学数据中心
搜集汇总
数据集介绍
背景与挑战
背景概述
该数据集包含2018年青海省门源县西营河站的气象梯度观测数据,涵盖多种气象要素,但部分时段和传感器数据存在缺失或异常。
以上内容由遇见数据集搜集并总结生成


