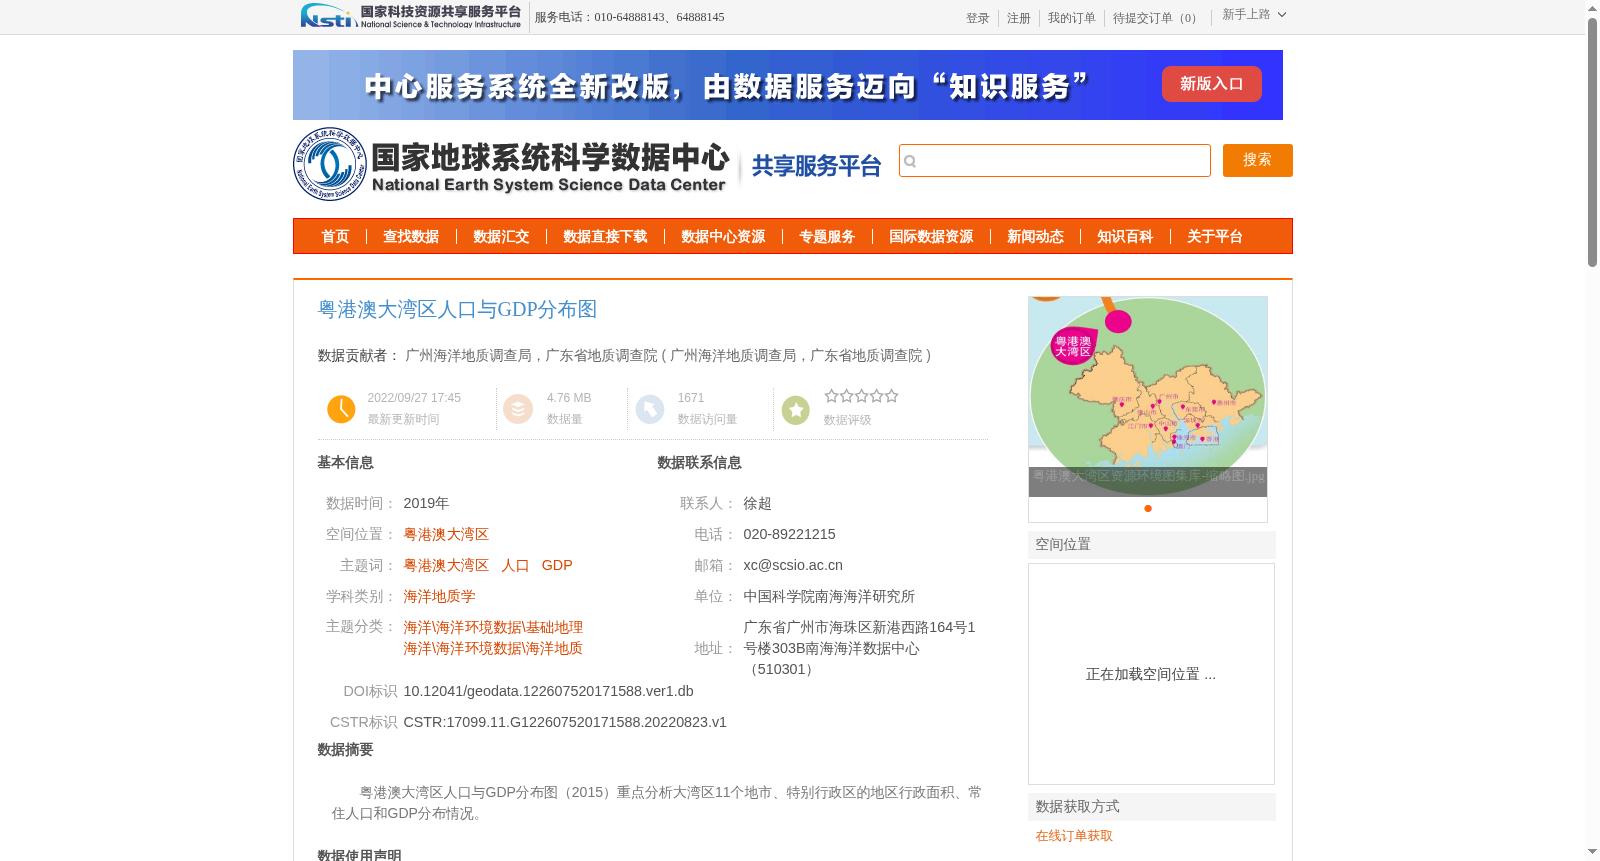
粤港澳大湾区人口与GDP分布图
收藏国家地球系统科学数据中心2022-09-27 更新2024-03-04 收录
下载链接:
https://www.geodata.cn/data/datadetails.html?dataguid=122607520171588&docId=7121
下载链接
链接失效反馈官方服务:
资源简介:
粤港澳大湾区人口与GDP分布图(2015)重点分析大湾区11个地市、特别行政区的地区行政面积、常住人口和GDP分布情况。
2015 Population and GDP Distribution Map of the Guangdong-Hong Kong-Macao Greater Bay Area focuses on analyzing the administrative area, permanent resident population and GDP distribution of the 11 prefecture-level cities and special administrative regions within the Greater Bay Area.
提供机构:
广州海洋地质调查局,广东省地质调查院
创建时间:
2022-08-23
搜集汇总
数据集介绍
背景与挑战
背景概述
该数据集提供了2019年粤港澳大湾区11个地市和特别行政区的人口与GDP分布情况,包括地区行政面积、常住人口和GDP数据,数据质量可靠,适用于海洋地质学及相关领域的研究。
以上内容由遇见数据集搜集并总结生成


