ziq/RSNA-ATD2023
收藏数据集概述
基本信息
- 数据集名称: RSNA-ATD2023
- 语言: 英语
- 许可证: MIT
- 多语言性: 单语种
- 数据集大小: 10K<n<100K
- 任务类别: 图像分割
- 任务ID: 语义分割
数据内容
- 文件格式:
.png - 数据类型: CT扫描图像及其对应的原始掩码
- 数据集组成: 205个CT扫描系列
数据结构
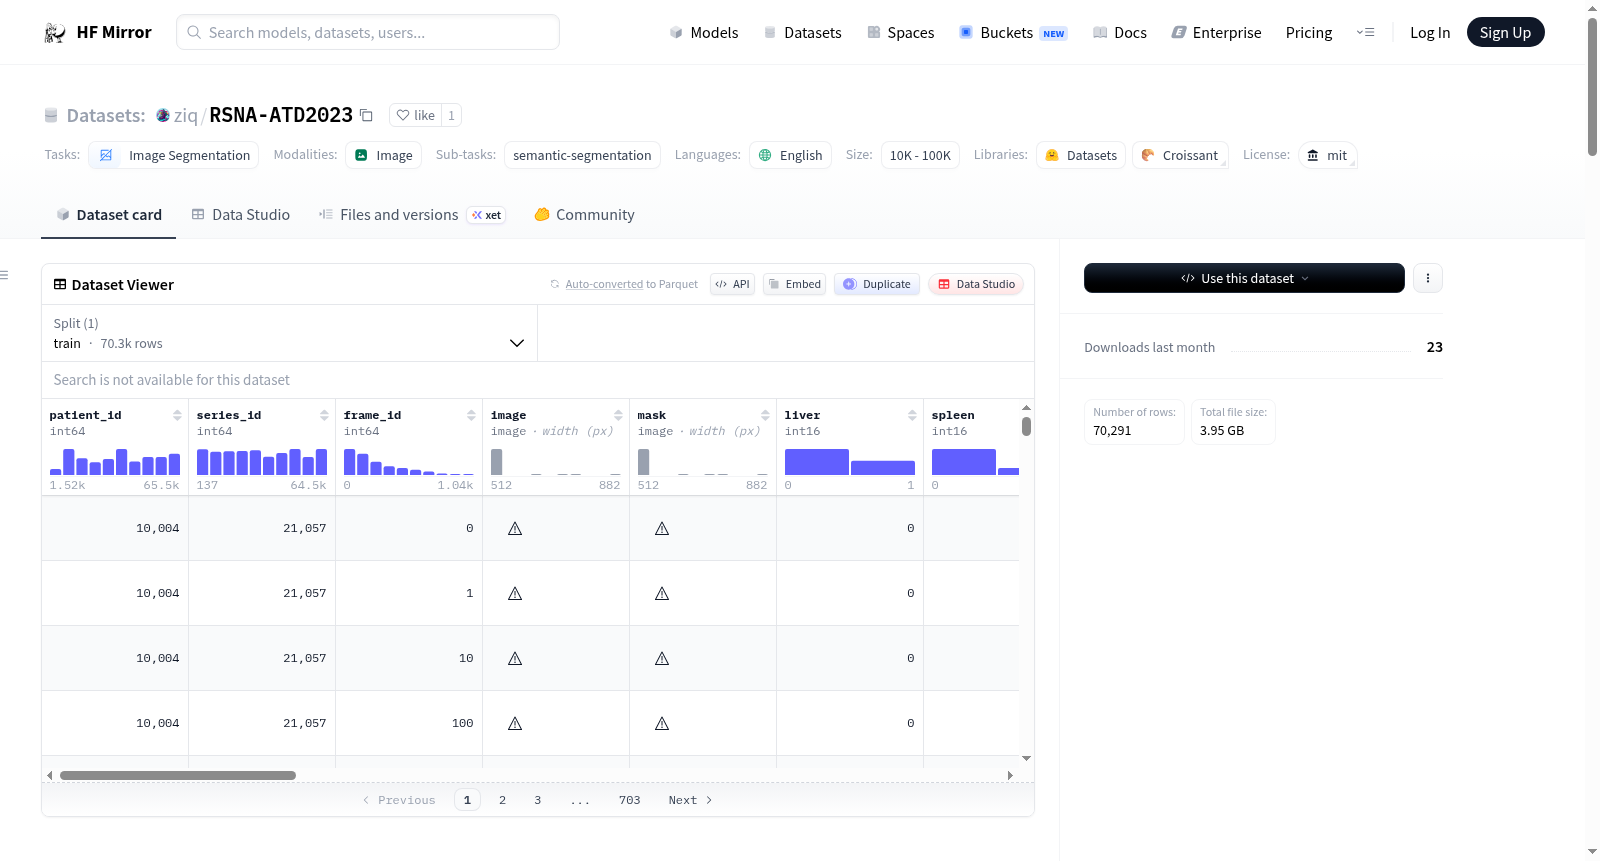
- 训练集: 包含70291行数据
- 特征: [patient_id, series_id, frame_id, image, mask]
标签
- 标签列表: ["background", "liver", "spleen", "right_kidney", "left_kidney", "bowel"]
使用示例
-
加载数据集: python from datasets import load_dataset data = load_dataset(ziq/RSNA-ATD2023)
-
训练测试分割: python data = data[train].train_test_split(test_size=0.2) train, test = data[train], data[test]
-
获取图像和分割掩码: python ids = 3 image, mask = train[ids][image], train[ids][mask]
-
可视化图像和掩码: python fig = plt.figure(figsize=(16,16)) ax1 = fig.add_subplot(131) plt.axis(off) ax1.imshow(image, cmap=gray) ax2 = fig.add_subplot(132) plt.axis(off) ax2.imshow(mask, cmap=gray) ax3 = fig.add_subplot(133) ax3.imshow(image*np.where(mask>0,1,0), cmap=gray) plt.axis(off) plt.show()
-
自定义颜色映射: python from matplotlib.colors import ListedColormap, BoundaryNorm colors = [#02020e, #520e6d, #c13a50, #f57d15, #fac62c, #f4f88e] bounds = range(0, len(colors) + 1) cmap, norm = ListedColormap(colors), BoundaryNorm(bounds, len(colors))
-
绘制分割掩码: python def plot_mask(mask, alpha=1.0): _, ax = plt.subplots() cax = ax.imshow(mask, cmap=cmap, norm=norm, alpha=alpha) cbar = plt.colorbar(cax, cmap=cmap, norm=norm, boundaries=bounds, ticks=bounds) cbar.set_ticks([]) _labels = [""] + labels for i in range(1, len(_labels)): cbar.ax.text(2, -0.5 + i, _labels[i], ha=left, color=colors[i - 1], fontsize=8) plt.axis(off) plt.show()
-
绘制单个类别: python liver, spleen, right_kidney, left_kidney, bowel = [(mask == i,1,0)[0] * i for i in range(1, len(labels))] plot_mask(liver)