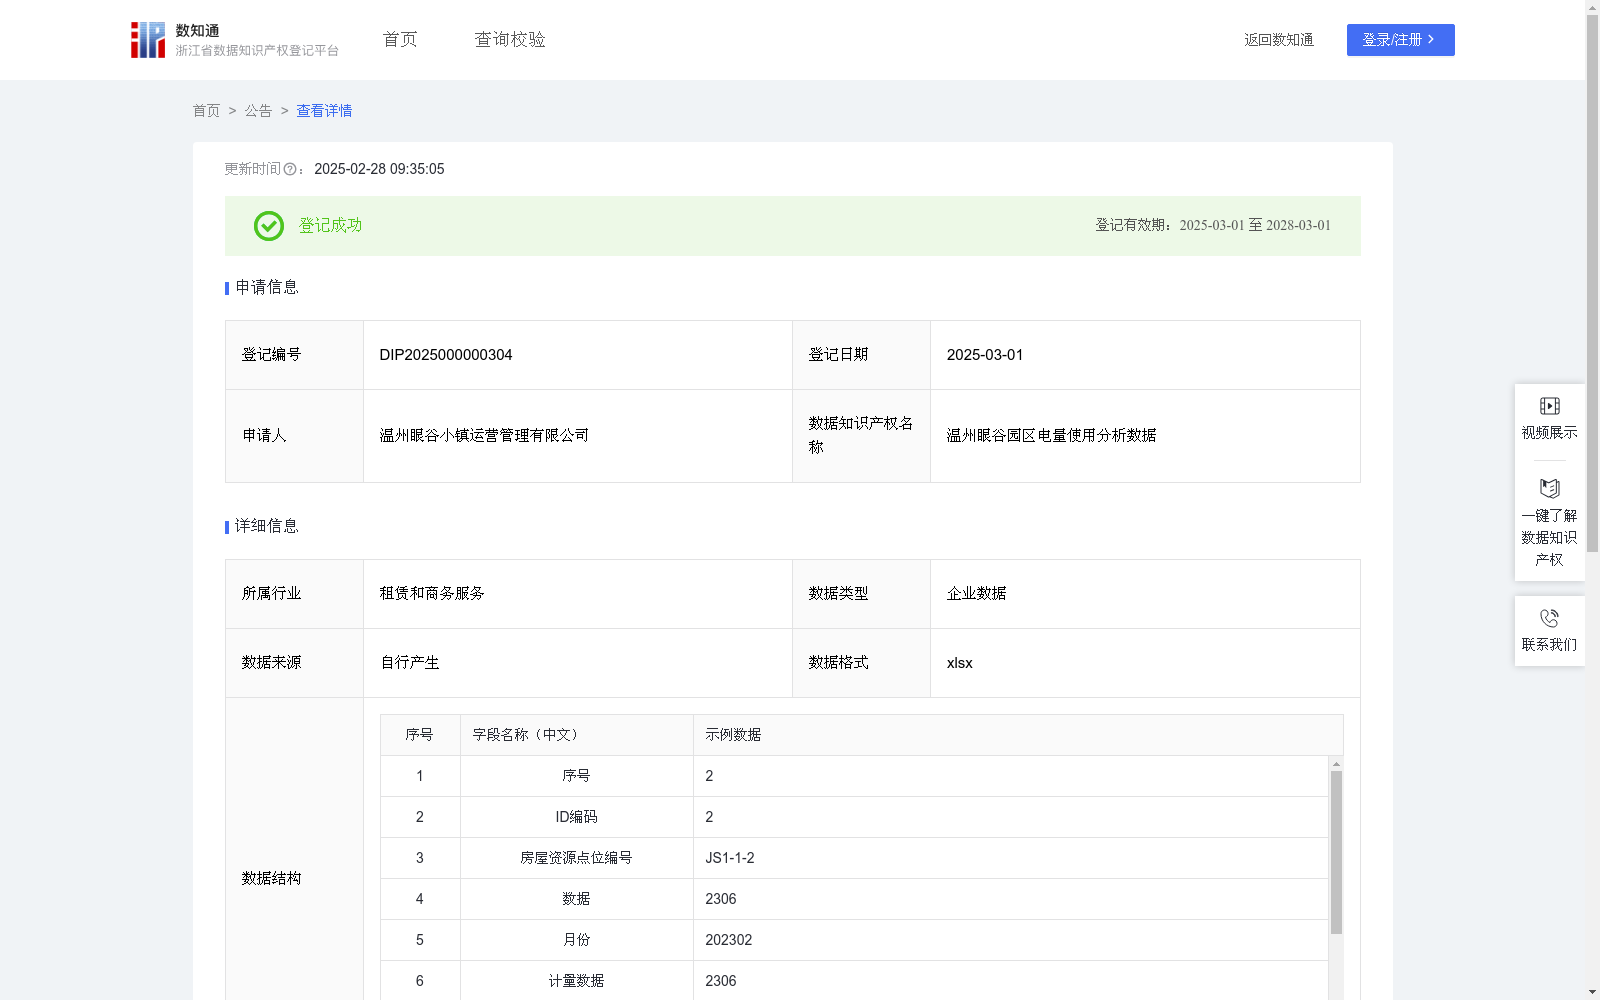
温州眼谷园区电量使用分析数据
收藏浙江省数据知识产权登记平台2025-02-28 更新2025-03-01 收录
下载链接:
https://www.zjip.org.cn/home/announce/trends/114737
下载链接
链接失效反馈官方服务:
资源简介:
温州眼谷园区电量使用分析数据:温州眼谷园区电量使用分析数据应用场景:基于园区各房屋资源点位用电数据,精准把握电力消耗情况,包括单月用电量、每日均值、上月用电量及当月增长率等。除内部能源管理优化外,数据应用模式可以推广到其他园区管理,助力招商引资与产业布局;与能源供应商协商电价、提供负荷预测,实现互利共赢;结合企业运营数据,为企业提供节能建议,提升园区产业能效,促进经济与环境协调发展,拓展数据实用性与复用性。1、数据采集:管理人员通过园区内部电表获取园区内各房屋资源点位的每月用电情况,并进行汇总统计。
2、数据处理:以园区内房屋资源点位编号作为唯一标识,通过筛选数据库中的记录,提取出每个房屋资源点位的所在楼层、单月用电量、上月用电量等信息,并通过算法规则进行综合分析。
3、算法规则:
每日用电均量=单月用电量/天数;
当月用电增长率=(单月用电量-上月用电量)/上月用电量;其中增长率大于100%为重点关注资源点位,说明该点位入住用户经营需求旺盛,能源需求较大;增长率为负数,且绝对值大于50%以上,说明入住用户经营用电明显减少,用户经营情况较上月明显降低,能源需求较少。
4、数据应用:通过可视化界面直观展现园区内各房屋资源点位的电力消耗情况,根据实时数据监控用电增长率,设置阈值并实施预警,以便及时应对异常用电消耗,对于重点关注房屋资源点位,立即采取调查和优化措施,确保入住用户正常经营和园区正常的能源供给。对于负增长关注用户,定期监测和评估,通过园区导入产业资源,进行金融资助和产业扶持。
Power Consumption Analysis Data of Wenzhou Eye Valley Park
Application Scenarios: Based on the electricity consumption data of each housing resource location within the park, this dataset enables accurate grasping of power consumption status, including monthly electricity consumption, daily average consumption, previous month's electricity consumption, current month's growth rate, and other metrics. In addition to optimizing internal energy management, this data application model can be extended to other park management scenarios, facilitating investment attraction and industrial layout; negotiating electricity prices with energy suppliers, providing load forecasting to achieve win-win outcomes; combining with enterprise operation data to provide energy-saving suggestions for enterprises, improving the energy efficiency of the park's industries, promoting the coordinated development of economy and environment, and enhancing the practicality and reusability of the dataset.
1. Data Collection: Managers collect the monthly electricity consumption of each housing resource location in the park via the park's internal electricity meters, and conduct aggregated statistics.
2. Data Processing: Take the housing resource location number within the park as the unique identifier, filter records in the database to extract information such as the floor where each housing resource location is situated, monthly electricity consumption, previous month's electricity consumption, and other relevant data, then perform comprehensive analysis via algorithmic rules.
3. Algorithmic Rules:
Daily average electricity consumption = Monthly electricity consumption / Number of days in the month;
Current month's electricity growth rate = (Monthly electricity consumption - Previous month's electricity consumption) / Previous month's electricity consumption;
Resource locations with a growth rate exceeding 100% are classified as key monitoring points, indicating that resident users have robust business demands and high energy demand;
For resource locations with negative growth rate and an absolute value greater than 50%, it signifies that the business electricity consumption of resident users has decreased significantly, with the users' business conditions deteriorating notably compared to the previous month and low energy demand.
4. Data Application: Present the power consumption status of each housing resource location in the park intuitively through a visual interface, monitor the electricity growth rate based on real-time data, set thresholds and implement early warnings to promptly respond to abnormal electricity consumption. For key monitoring housing resource locations, immediately conduct investigations and optimization measures to ensure the normal operation of resident users and the park's stable energy supply. For users with negative growth, conduct regular monitoring and evaluation, and provide financial assistance and industrial support by introducing industrial resources into the park.
提供机构:
温州眼谷小镇运营管理有限公司
创建时间:
2025-01-14
搜集汇总
数据集介绍
特点
该数据集包含温州眼谷园区各房屋资源点位的用电数据,如单月用电量、每日用电均值、上月用电量及当月增长率等,共计526条记录,每月更新。数据可用于园区能源管理优化、招商引资、电价协商及企业节能建议等场景,通过算法规则进行综合分析并实现可视化监控。
以上内容由遇见数据集搜集并总结生成


