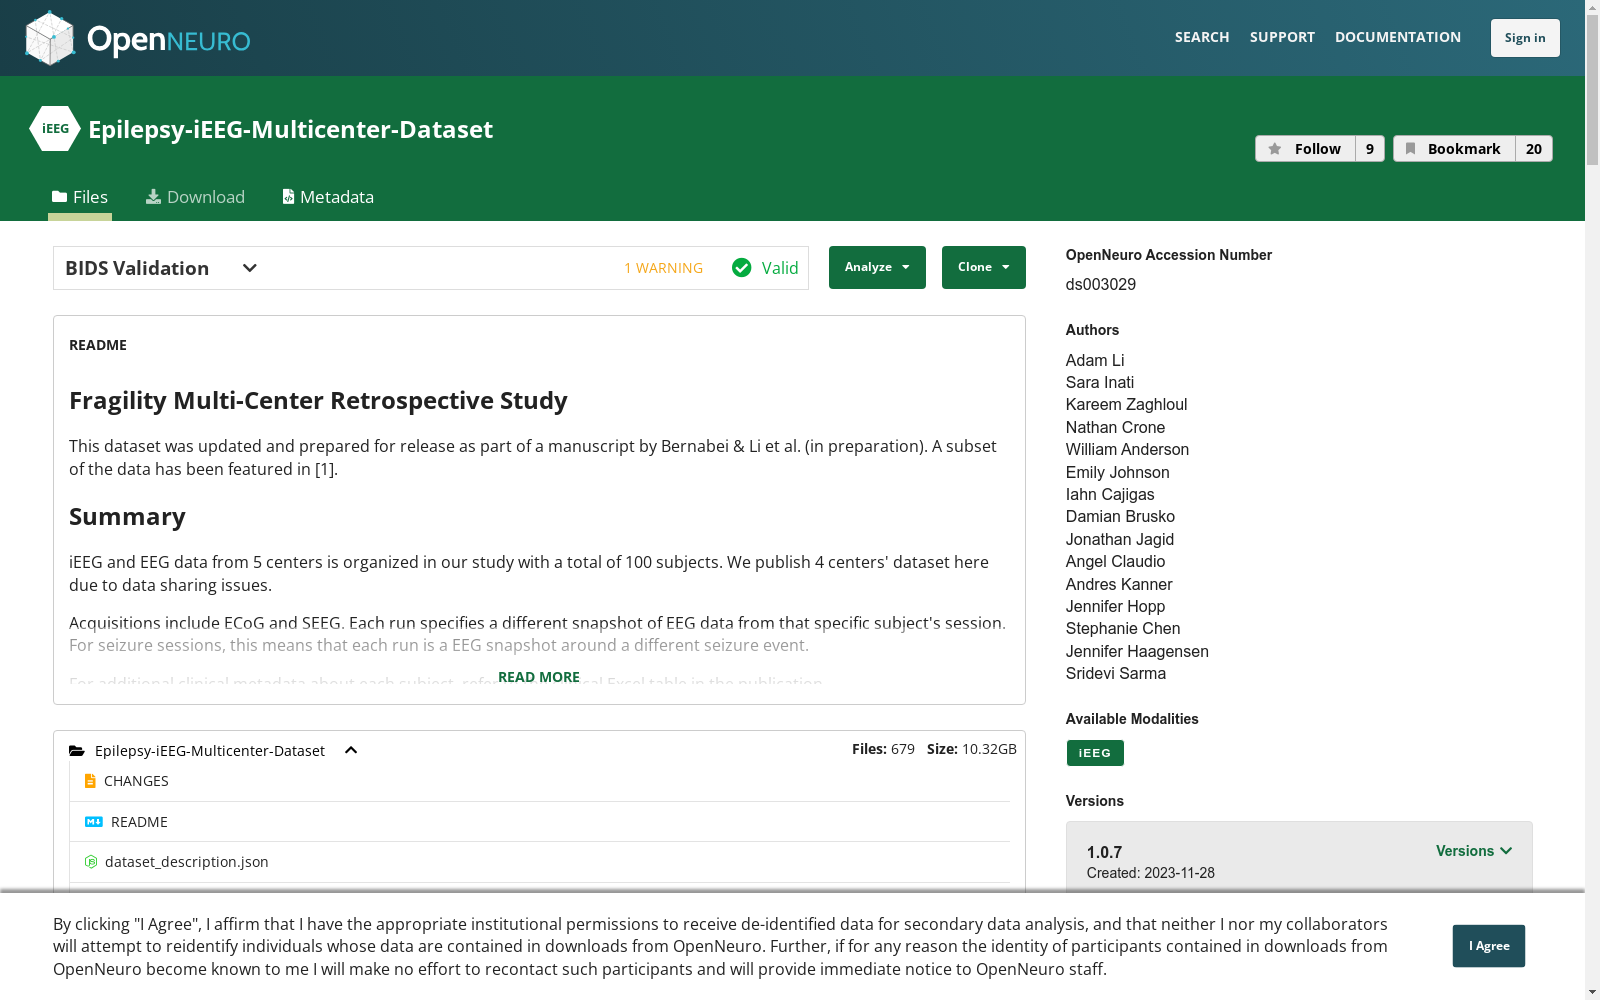
Epilepsy-iEEG-Multicenter-Dataset
收藏OpenNeuro2020-07-26 更新2026-03-14 收录
下载链接:
https://openneuro.org/datasets/ds003029
下载链接
链接失效反馈官方服务:
资源简介:
Fragility Multi-Center Retrospective Study
------------------------------------------
This dataset was updated and prepared for release as part of a manuscript by Bernabei & Li et al. (in preparation). A subset of the data has been featured in [1].
Summary
-------------
iEEG and EEG data from 5 centers is organized in our study with a total of 100 subjects. We publish 4 centers' dataset here due to data sharing issues.
Acquisitions include ECoG and SEEG. Each run specifies a different snapshot of EEG data from that specific subject's session. For seizure sessions, this means that each run is a EEG snapshot around a different seizure event.
For additional clinical metadata about each subject, refer to the clinical Excel table in the publication.
Data Availability
----------------------
NIH, JHH, UMMC, and UMF agreed to share. Cleveland Clinic did not, so requires an additional DUA.
All data, except for Cleveland Clinic was approved by their centers to be de-identified and shared. All data in this dataset have no PHI, or other identifiers associated with patient. In order to access Cleveland Clinic data, please forward all requests to Amber Sours, SOURSA@ccf.org:
Amber Sours, MPH
Research Supervisor | Epilepsy Center
Cleveland Clinic | 9500 Euclid Ave. S3-399 | Cleveland, OH 44195
(216) 444-8638
You will need to sign a data use agreement (DUA).
Sourcedata
----------------
For each subject, there was a raw EDF file, which was converted into the BrainVision format with `mne_bids`.
Each subject with SEEG implantation from Cleveland Clinic, also has an Excel table, called `electrode_layout.xlsx`, which outlines where the clinicians marked each electrode anatomically. Note that there is no rigorous atlas applied, so the main points of interest are: `WM`, `GM`, `VENTRICLE`, `CSF`, and `OUT`, which represent white-matter, gray-matter, ventricle, cerebrospinal fluid and outside the brain. WM, Ventricle, CSF and OUT were removed channels from further analysis. These were labeled in the corresponding BIDS `channels.tsv` sidecar file as `status=bad`.
The dataset uploaded to `openneuro.org` does not contain the `sourcedata` since there was an extra
anonymization step that occurred when fully converting to BIDS.
Derivatives
----------------
Derivatives include:
* fragility analysis
* frequency analysis
* graph metrics analysis
* figures
These can be computed by following the following paper:
[Neural Fragility as an EEG Marker for the Seizure Onset Zone](https://www.biorxiv.org/content/10.1101/862797v3)
Channel locations in (x,y,z) coordinates
--------------------------------------------------------
Unfortunately, the necessary T1 MRI, and CT scans to estimate these were not collected/processed, and exact channel locations are not available for any subject in this dataset as of 09/05/2023. The approximate brain regions of the hypothesized epileptic regions are stated in the metadata and paper.
Events and Descriptions
-----------------------------------
Within each EDF file, there contain event markers that are annotated by clinicians, which may inform you of specific clinical events that are occuring in time, or of when they saw seizures onset and offset (clinical and electrographic).
During a seizure event, specifically event markers may follow this time course:
* eeg onset, or clinical onset - the onset of a seizure that is either marked electrographically, or by clinical behavior. Note that the clinical onset may not always be present, since some seizures manifest without clinical behavioral changes.
* Marker/Mark On - these are usually annotations within some cases, where a health practitioner injects a chemical marker for use in ICTAL SPECT imaging after a seizure occurs. This is commonly done to see which portions of the brain are active metabolically.
* Marker/Mark Off - This is when the ICTAL SPECT stops imaging.
* eeg offset, or clinical offset - this is the offset of the seizure, as determined either electrographically, or by clinical symptoms.
Other events included may be beneficial for you to understand the time-course of each seizure. Note that ICTAL SPECT occurs in all Cleveland Clinic data. Note that seizure markers are not consistent in their description naming, so one might encode some specific regular-expression rules to consistently capture seizure onset/offset markers across all dataset. In the case of UMMC data, all onset and offset markers were provided by the clinicians on an Excel sheet instead of via the EDF file. So we went in and added the annotations manually to each EDF file.
Seizure Electrographic and Clinical Onset Annotations
-----------------------------------------------------------------------------
For various datasets, there are seizures present within the dataset. Generally there is only one seizure per EDF file. When seizures are present, they are marked electrographically (and clinically if present) via standard approaches in the epilepsy clinical workflow.
Clinical onset are just manifestation of the seizures with clinical syndromes. Sometimes the maker may not be present.
Seizure Onset Zone Annotations
-----------------------------------------------
What is actually important in the evaluation of datasets is the clinical annotations of their localization hypotheses of the seizure onset zone.
These generally include:
* early onset: the earliest onset electrodes participating in the seizure that clinicians saw
* early/late spread (optional): the electrodes that showed epileptic spread activity after seizure onset. Not all seizures has spread contacts annotated.
Surgical Zone (Resection or Ablation) Annotations
-----------------------------------------------------------------------
For patients with the post-surgical MRI available, then the segmentation process outlined above tells us which electrodes were within the surgical removed brain region.
Otherwise, clinicians give us their best estimate, of which electrodes were resected/ablated based on their surgical notes.
For surgical patients whose postoperative medical records did not explicitly indicate specific resected or ablated contacts, manual visual inspection was performed to determine the approximate contacts that were located in later resected/ablated tissue. Postoperative T1 MRI scans were compared against post-SEEG implantation CT scans or CURRY coregistrations of preoperative MRI/post SEEG CT scans. Contacts of interest in and around the area of the reported resection were selected individually and the corresponding slice was navigated to on the CT scan or CURRY coregistration. After identifying landmarks of that slice (e.g. skull shape, skull features, shape of prominent brain structures like the ventricles, central sulcus, superior temporal gyrus, etc.), the location of a given contact in relation to these landmarks, and the location of the slice along the axial plane, the corresponding slice in the postoperative MRI scan was navigated to. The resected tissue within the slice was then visually inspected and compared against the distinct landmarks identified in the CT scans, if brain tissue was not present in the corresponding location of the contact, then the contact was marked as resected/ablated. This process was repeated for each contact of interest.
References
-----------------
[1] Adam Li, Chester Huynh, Zachary Fitzgerald, Iahn Cajigas, Damian Brusko, Jonathan Jagid, Angel Claudio, Andres Kanner, Jennifer Hopp, Stephanie Chen, Jennifer Haagensen, Emily Johnson, William Anderson, Nathan Crone, Sara Inati, Kareem Zaghloul, Juan Bulacio, Jorge Gonzalez-Martinez, Sridevi V. Sarma. Neural Fragility as an EEG Marker of the Seizure Onset Zone. bioRxiv 862797; doi: https://doi.org/10.1101/862797
[2] Appelhoff, S., Sanderson, M., Brooks, T., Vliet, M., Quentin, R., Holdgraf, C., Chaumon, M., Mikulan, E., Tavabi, K., Höchenberger, R., Welke, D., Brunner, C., Rockhill, A., Larson, E., Gramfort, A. and Jas, M. (2019). MNE-BIDS: Organizing electrophysiological data into the BIDS format and facilitating their analysis. Journal of Open Source Software 4: (1896). https://doi.org/10.21105/joss.01896
[3] Holdgraf, C., Appelhoff, S., Bickel, S., Bouchard, K., D'Ambrosio, S., David, O., … Hermes, D. (2019). iEEG-BIDS, extending the Brain Imaging Data Structure specification to human intracranial electrophysiology. Scientific Data, 6, 102. https://doi.org/10.1038/s41597-019-0105-7
[4] Pernet, C. R., Appelhoff, S., Gorgolewski, K. J., Flandin, G., Phillips, C., Delorme, A., Oostenveld, R. (2019). EEG-BIDS, an extension to the brain imaging data structure for electroencephalography. Scientific Data, 6, 103. https://doi.org/10.1038/s41597-019-0104-8
脆性多中心回顾性研究
------------------------------------------
本数据集由Bernabei与Li等人(论文待投)的研究手稿筹备更新并公开发布,其部分数据已在文献[1]中展示。
摘要
-------------
本研究共纳入来自5个中心的颅内脑电图(iEEG, intracranial electroencephalogram)与脑电图(EEG, electroencephalogram)数据,覆盖100名受试者。受数据共享规则限制,本次公开的为其中4个中心的数据集。
采集方案
-------------
采集数据涵盖皮层脑电图(ECoG, electrocorticography)与立体定向脑电图(SEEG, stereoelectroencephalography)。每个采集段(run)对应特定受试者单次记录中的一段脑电图快照。对于癫痫发作期记录而言,每个采集段即围绕某次不同癫痫发作事件的脑电图快照。
如需获取每位受试者的补充临床元数据,请查阅公开材料中的临床Excel表格。
数据可用性说明
----------------------
美国国立卫生研究院(NIH)、约翰·霍普金斯医院(JHH)、马里兰大学医学中心(UMMC)及密歇根大学医学院(UMF)均同意共享数据;克利夫兰医学中心(Cleveland Clinic)未直接开放,需额外签署数据使用协议(DUA, Data Use Agreement)。除克利夫兰医学中心的数据外,其余所有数据均已通过各中心的去标识化审核并获准共享。本数据集所有数据均不包含患者健康信息(PHI, Protected Health Information)或其他患者识别标识。如需获取克利夫兰医学中心的数据,请将所有申请发送至Amber Sours,邮箱:SOURSA@ccf.org:
Amber Sours, MPH
研究主管 | 癫痫中心
克利夫兰医学中心 | 9500 Euclid Ave. S3-399 | 俄亥俄州克利夫兰市,44195
联系电话:(216) 444-8638
您需签署数据使用协议后方可访问。
源数据
----------------
每位受试者对应一份原始EDF格式文件,已通过`mne_bids`工具转换为BrainVision格式。来自克利夫兰医学中心且接受立体定向脑电图植入的受试者,还附带一份名为`electrode_layout.xlsx`的Excel表格,其中记录了临床医生对各电极的解剖位置标注。需注意,本研究未使用严格的解剖图谱,仅标注了以下几类关键区域:`WM`(白质,white-matter)、`GM`(灰质,gray-matter)、`VENTRICLE`(脑室,ventricle)、`CSF`(脑脊液,cerebrospinal fluid)及`OUT`(颅外,outside the brain)。其中WM、脑室、脑脊液及颅外通道将被排除在后续分析之外,这些通道会在对应脑成像数据结构(BIDS, Brain Imaging Data Structure)格式的`channels.tsv`附属文件中被标记为`status=bad`。上传至`openneuro.org`的数据集未包含原始源数据(sourcedata),因为在完整转换为BIDS格式的过程中需执行额外的匿名化步骤。
衍生分析数据
----------------
衍生分析数据包括:
* 脆性分析
* 频域分析
* 图论指标分析
* 可视化图表
所有衍生数据均可通过以下论文中的方法计算得到:
《神经脆性作为癫痫发作起始区的脑电图标志物》(Neural Fragility as an EEG Marker for the Seizure Onset Zone),链接:https://www.biorxiv.org/content/10.1101/862797v3
电极三维坐标信息
--------------------------------------------------------
遗憾的是,用于计算电极三维(x,y,z)坐标所需的T1加权磁共振成像(MRI)与计算机断层扫描(CT)数据未被采集或处理,截至2023年9月5日,本数据集所有受试者均无精确的电极位置信息。假设的癫痫发作相关脑区的大致位置已在元数据及研究论文中说明。
事件与标注说明
-----------------------------------
每份EDF文件中均包含临床医生标注的事件标记,可用于识别记录时段内发生的具体临床事件,或癫痫发作的起始与终止时间(包括临床发作与脑电发作)。癫痫发作期间的事件标记通常遵循以下时间流程:
* 脑电发作起始或临床发作起始:指通过脑电监测或临床行为观察确认的癫痫发作起始。需注意,部分癫痫发作仅表现为脑电异常而无临床行为改变,因此临床发作起始标记可能缺失。
* 标记开启(Marker/Mark On):在部分病例中,临床医生会在癫痫发作后注射化学标记物,用于发作期单光子发射计算机断层扫描(ICTAL SPECT)成像,以明确脑内代谢活跃的区域。
* 标记关闭(Marker/Mark Off):发作期SPECT成像结束的时间点。
* 脑电发作终止或临床发作终止:指通过脑电监测或临床症状确认的癫痫发作终止。
其他附带事件可帮助您理解单次癫痫发作的完整时间进程。需注意,克利夫兰医学中心的所有数据均包含发作期SPECT记录。此外,不同数据集中的癫痫发作标记命名并不统一,您可通过正则表达式规则实现全数据集癫痫发作起始/终止标记的统一提取。对于UMMC的数据集,所有发作起始与终止标记均由临床医生整理在Excel表格中,而非直接嵌入EDF文件,因此我们已手动将这些标注补充至每份EDF文件内。
癫痫脑电与临床发作起始标注
-----------------------------------------------------------------------------
不同数据集中均包含癫痫发作记录,通常每份EDF文件仅对应一次癫痫发作。若存在癫痫发作记录,将按照癫痫临床诊疗的标准流程,通过脑电监测(若有临床发作表现则同时结合临床症状)进行标记。临床发作起始仅指伴随临床综合征的癫痫发作表现,该标记有时可能缺失。
癫痫发作起始区标注
-----------------------------------------------
本数据集评估的核心为临床医生对癫痫发作起始区的定位假设标注,通常包含以下内容:
* 早期起始电极:临床医生观察到的最早参与癫痫发作的电极位点
* 早期/晚期扩散电极(可选):癫痫发作起始后出现痫样扩散活动的电极位点,并非所有发作记录都包含扩散电极标注。
手术切除/消融区域标注
-----------------------------------------------------------------------
对于有术后磁共振成像(MRI)数据的患者,可通过前文所述的分割流程确定哪些电极位于手术切除的脑区范围内。若无可供参考的术后MRI,则由临床医生根据手术记录自行估算被切除或消融的电极位点。
对于术后医疗记录未明确标注具体切除/消融电极的手术患者,研究人员通过手动视觉检查来估算位于后续切除/消融脑组织内的电极位点:将术后T1加权MRI与SEEG植入后的CT扫描,或术前MRI与术后SEEG CT的CURRY配准图像进行对比。首先逐个选取报告切除区域及其周边的目标电极,并在CT扫描或CURRY配准图像中定位对应的扫描层面。识别该层面的解剖标志(如颅骨形态、颅骨特征、脑室、中央沟、颞上回等显著脑结构形态),结合目标电极相对于这些标志的位置,以及该层面在轴位平面上的位置,定位术后MRI对应的扫描层面。随后目视检查该层面内的切除组织,并与CT扫描中识别的解剖标志进行比对:若目标电极对应位置无脑组织,则将该电极标记为已切除/消融。该流程将对每个目标电极重复执行。
参考文献
-----------------
[1] Adam Li, Chester Huynh, Zachary Fitzgerald, Iahn Cajigas, Damian Brusko, Jonathan Jagid, Angel Claudio, Andres Kanner, Jennifer Hopp, Stephanie Chen, Jennifer Haagensen, Emily Johnson, William Anderson, Nathan Crone, Sara Inati, Kareem Zaghloul, Juan Bulacio, Jorge Gonzalez-Martinez, Sridevi V. Sarma. 神经脆性作为癫痫发作起始区的脑电图标志物. bioRxiv 862797; doi: https://doi.org/10.1101/862797
[2] Appelhoff, S., Sanderson, M., Brooks, T., Vliet, M., Quentin, R., Holdgraf, C., Chaumon, M., Mikulan, E., Tavabi, K., Höchenberger, R., Welke, D., Brunner, C., Rockhill, A., Larson, E., Gramfort, A. and Jas, M. (2019). MNE-BIDS:将脑电数据整理为BIDS格式并促进分析. 开源软件期刊, 4: (1896). https://doi.org/10.21105/joss.01896
[3] Holdgraf, C., Appelhoff, S., Bickel, S., Bouchard, K., D'Ambrosio, S., David, O., … Hermes, D. (2019). iEEG-BIDS:将脑成像数据结构规范扩展至人类颅内脑电领域. 科学数据, 6, 102. https://doi.org/10.1038/s41597-019-0105-7
[4] Pernet, C. R., Appelhoff, S., Gorgolewski, K. J., Flandin, G., Phillips, C., Delorme, A., Oostenveld, R. (2019). EEG-BIDS:脑成像数据结构在脑电图领域的扩展. 科学数据, 6, 103. https://doi.org/10.1038/s41597-019-0104-8
创建时间:
2020-07-26
搜集汇总
数据集介绍
背景与挑战
背景概述
该数据集是一个多中心癫痫病研究的iEEG和EEG数据集,包含100名受试者的数据,重点关注癫痫发作区域的定位和分析。数据集提供了丰富的临床和电生理数据,但由于数据共享问题,仅公开了4个中心的数据。
以上内容由遇见数据集搜集并总结生成


