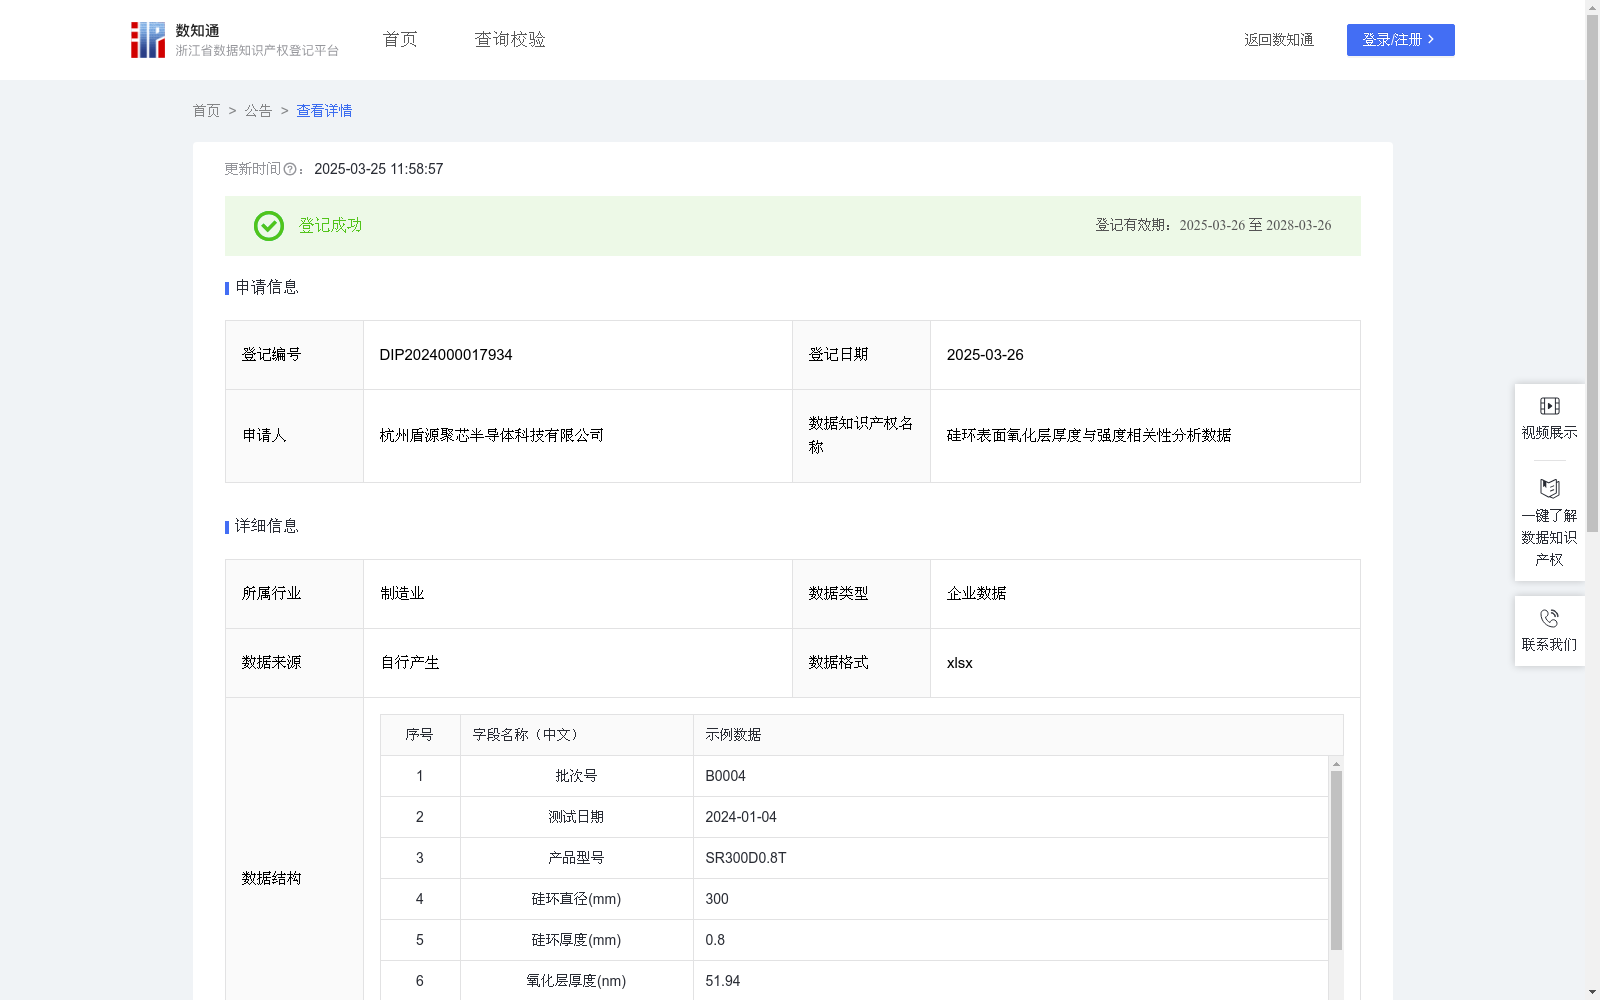
硅环表面氧化层厚度与强度相关性分析数据
收藏资源简介:
相关系数是衡量硅环表面氧化层厚度与强度之间线性关系强度和方向的统计指标,而斜率和截距作为线性方程的核心参数,共同决定了回归直线在坐标系中的位置和倾斜程度,有助于表面处理工艺优化和强度预测。通过对硅环表面氧化层厚度和强度的测试数据进行长期积累,并持续跟踪计算它们之间的相关系数、斜率和截距,具有重要的工程实践意义。随着数据规模的不断增加,相关系数、斜率和截距的计算值将会越来越准确,更好地反映表面氧化层特性与材料强度之间的内在关系。 这些数据分析结果可以为硅材料加工领域的工艺工程师、质量管理人员、产品检验人员和生产技术人员提供有力支持,帮助他们开展表面处理工艺优化、氧化层控制、强度预测和储存环境改进等工作。这些分析对评估产品可靠性、监控氧化层变化、优化表面处理工艺和提升产品性能具有重要的指导价值,从而提高硅环产品的强度稳定性、环境适应性和使用寿命。 通过科学的数据分析,可以更好地理解表面氧化层厚度对产品强度的影响规律,特别是确定最佳氧化层厚度范围,为工艺优化和质量控制提供可靠的数据支持,最终实现硅环产品性能的精确控制和质量提升,满足下游应用对产品可靠性的严格要求。1、数据采集和预处理: (1)数据采集:采集硅环表面特性的测试结果数据,包括:测试日期、批次号、 产品型号、硅环直径(mm)、硅环厚度(mm)、表面氧化层厚度(nm)、强度(MPa)。 (2)数据预处理:对采集的数据进行清洗,剔除氧化层厚度超出10-100nm范围的异常值;剔除强度超出300-500MPa范围的异常值;去除重复、错误或无关的信息,确保数据的准确性和完整性。 2、数据加工和分析: (1)计算相关系数: ①将历史采集的氧化层厚度和强度数据以及本次测试的数据汇总,形成X(氧化层厚度)、Y(强度)两个变量集合。 ②利用CORREL函数计算变量集合X、Y之间的相关系数,具体公式为:相关系数 = Cov(X,Y)/sX*sY,其中,Cov(X,Y)为X和Y协方差,sX、sY分别为氧化层厚度和强度的标准差。 (2)计算斜率和截距: ①利用LINEST函数,对变量集合X(氧化层厚度)、Y(强度)进行线性回归分析,建立两者之间的数学关系。 ②通过回归分析得到线性方程:Y = mX + b,其中:Y为强度(MPa);X为氧化层厚度(nm);m为斜率,表示氧化层厚度每增加1nm时,强度的变化量(MPa/nm);b为截距,表示理论基准强度值(MPa);通过斜率和截距的分析,评估氧化层厚度对强度的影响程度。
The correlation coefficient is a statistical indicator that measures the strength and direction of the linear relationship between the thickness of the surface oxide layer of silicon rings and their strength. As core parameters of the linear equation, the slope and intercept jointly determine the position and inclination of the regression line in the coordinate system, which contributes to surface treatment process optimization and strength prediction. Long-term accumulation of test data on the oxide layer thickness and strength of silicon rings, as well as continuous tracking and calculation of their correlation coefficient, slope and intercept, hold important engineering practical significance. As the data scale continues to grow, the calculated values of the correlation coefficient, slope and intercept will become increasingly accurate, better reflecting the intrinsic relationship between the surface oxide layer characteristics and the material strength. These data analysis results can provide strong support for process engineers, quality management personnel, product inspectors and production technicians in the field of silicon material processing, helping them carry out work such as surface treatment process optimization, oxide layer control, strength prediction and storage environment improvement. These analyses have important guiding value for evaluating product reliability, monitoring changes in the oxide layer, optimizing surface treatment processes and improving product performance, thereby improving the strength stability, environmental adaptability and service life of silicon ring products. Through scientific data analysis, the influence law of surface oxide layer thickness on product strength can be better understood, especially the optimal oxide layer thickness range can be determined, providing reliable data support for process optimization and quality control, and finally achieving precise control of the performance and quality improvement of silicon ring products, meeting the strict requirements of downstream applications on product reliability. 1、Data Collection and Preprocessing: (1) Data Collection: Collect test result data of the surface characteristics of silicon rings, including: test date, batch number, product model, silicon ring diameter (mm), silicon ring thickness (mm), surface oxide layer thickness (nm), and strength (MPa). (2) Data Preprocessing: Clean the collected data, eliminate outliers where the oxide layer thickness is outside the range of 10-100 nm; eliminate outliers where the strength is outside the range of 300-500 MPa; remove duplicate, erroneous or irrelevant information to ensure the accuracy and integrity of the data. 2、Data Processing and Analysis: (1) Calculate the correlation coefficient: ① Aggregate the historically collected oxide layer thickness and strength data with this test data to form two variable sets: X (oxide layer thickness) and Y (strength). ② Use the CORREL function to calculate the correlation coefficient between variable sets X and Y. The specific formula is: Correlation coefficient = Cov(X,Y)/(s_X * s_Y), where Cov(X,Y) is the covariance of X and Y, and s_X and s_Y are the standard deviations of the oxide layer thickness and strength, respectively. (2) Calculate the slope and intercept: ① Use the LINEST function to perform linear regression analysis on the variable sets X (oxide layer thickness) and Y (strength) to establish the mathematical relationship between the two. ② The linear equation obtained through regression analysis is: Y = mX + b, where: Y is the strength (MPa); X is the oxide layer thickness (nm); m is the slope, representing the change in strength (MPa/nm) when the oxide layer thickness increases by 1 nm; b is the intercept, representing the theoretical reference strength value (MPa). The influence degree of the oxide layer thickness on the strength is evaluated through the analysis of the slope and intercept.