粤港澳大湾区地面沉降风险划分图
收藏国家地球系统科学数据中心2022-09-27 更新2024-03-04 收录
下载链接:
https://www.geodata.cn/data/datadetails.html?dataguid=269942148397980&docId=7150
下载链接
链接失效反馈官方服务:
资源简介:
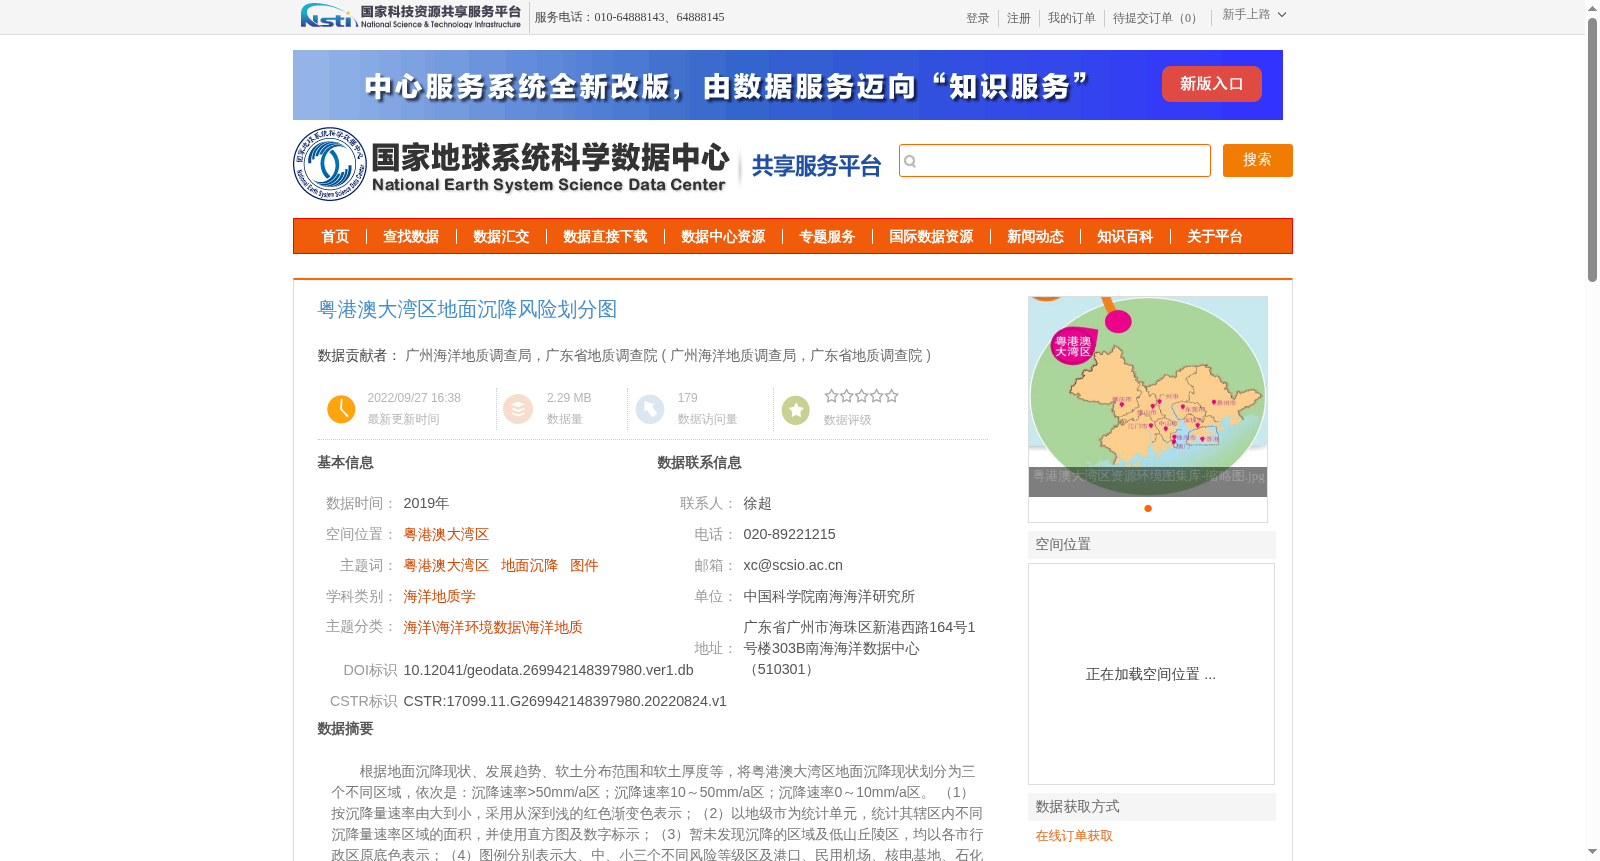
根据地面沉降现状、发展趋势、软土分布范围和软土厚度等,将粤港澳大湾区地面沉降现状划分为三个不同区域,依次是:沉降速率>50mm/a区;沉降速率10~50mm/a区;沉降速率0~10mm/a区。 (1)按沉降量速率由大到小,采用从深到浅的红色渐变色表示;(2)以地级市为统计单元,统计其辖区内不同沉降量速率区域的面积,并使用直方图及数字标示;(3)暂未发现沉降的区域及低山丘陵区,均以各市行政区原底色表示;(4)图例分别表示大、中、小三个不同风险等级区及港口、民用机场、核电基地、石化基地、输油、输气管道等重要交通、能源设施。
Based on the current status, development trend, distribution range and thickness of soft soil related to land subsidence, the current land subsidence situation in the Guangdong-Hong Kong-Macao Greater Bay Area is divided into three distinct regions in sequence: areas with subsidence rate > 50 mm/a; areas with subsidence rate of 10–50 mm/a; and areas with subsidence rate of 0–10 mm/a.
(1) A deep-to-shallow red gradient color is used to represent the regions, sorted in descending order of subsidence rate;
(2) Taking prefecture-level cities as the statistical unit, calculate the area of different subsidence rate regions within their respective administrative jurisdictions, and mark them with histograms and corresponding numerical values;
(3) Areas with no detected subsidence and low mountainous and hilly areas shall be marked with the original background color of their respective municipal administrative regions;
(4) The legend respectively represents the three risk grade zones (high, medium, low) as well as important transportation and energy facilities including ports, civil airports, nuclear power bases, petrochemical bases, oil and gas pipelines, etc.
提供机构:
广州海洋地质调查局,广东省地质调查院
创建时间:
2022-08-24
搜集汇总
数据集介绍
背景与挑战
背景概述
该数据集提供了2019年粤港澳大湾区地面沉降风险的详细划分图,根据沉降速率将区域划分为三个等级,并标注了重要交通和能源设施的位置。数据集由专业地质调查机构贡献,适用于海洋地质学和环境研究领域。
以上内容由遇见数据集搜集并总结生成


