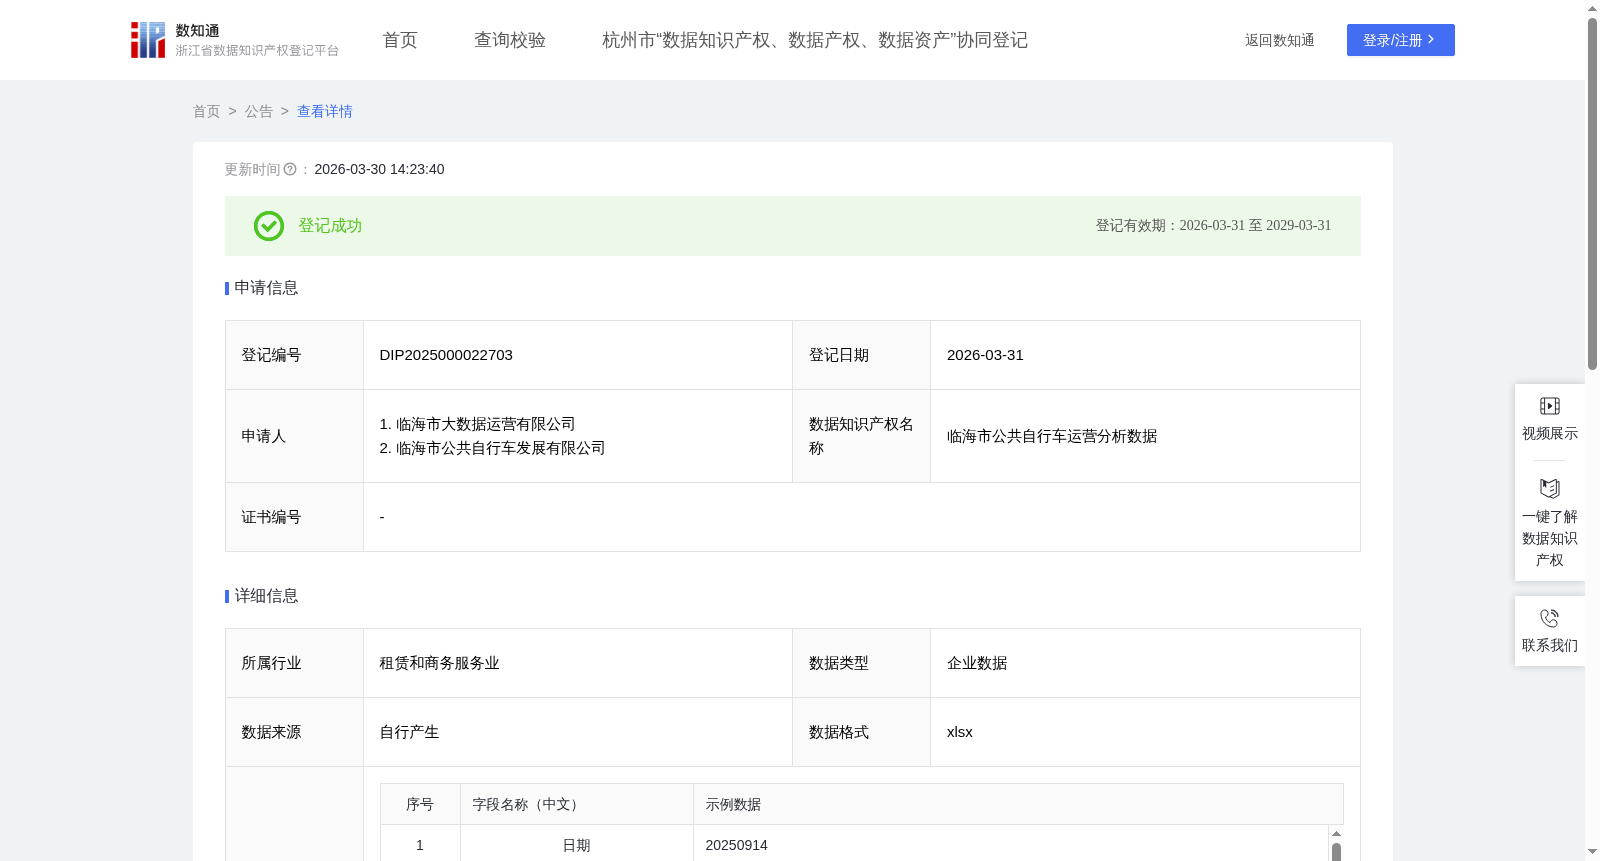
临海市公共自行车运营分析数据
收藏资源简介:
通过对公共自行车运营数据的分析,如对自行车或电动自行车的使用时长、借车次数、消费金额数据的统计分析,得出自行车或电动自行车的平均使用时长和平均使用率,通过分析各个站点的使用率、收入情况,加强对热门站点自行车或电动自行车的调度,合理优化公共自行车的运营策略。临海作为一个旅游城市,在节假日车辆众多,特别是老城区,节假日很拥堵,公共自行车、电动自行车可以为游客提供出行选择。根据节假日站点公共自行车使用数据,在相关站点推荐旅游景点、当地特色小吃等相关临海特色产品,给游客提供旅游建议,提供一个良好的旅游环境;通过数据分析,可以明显观察到某一区域自行车站点使用人数密集,表明该区域人流量大,可以为该区域商业选址提供决策依据。(1)首先对订单进行脱敏,导出订单数据; (2)对订单数据进行清洗,去除异常数据、处理部分数据缺失值; (3)清洗获得该站点当天普通自行车、电动自行车的借车次数、还车次数、消费金额和使用时长等数据;普通自行车、电动自行车使用时长(当天从该站点租借自行车所有订单的使用时间总和,单位秒);普通自行车、电动自行车借车次数(当天从该站点租借自行车所有订单借车次数总和);普通自行车、电动自行车消费金额(当天从该站点租借自行车所有订单金额总和); (4)数据加工:通过以下关键指标评估其运营数据,普通自行车平均使用时长【l】=普通自行车使用时长【f】 /普通自行车借车次数【g】;电动自行车平均使用时长【m】=电动自行车使用时长【i】 / 电动自行车借车次数【j】;平均使用率【n】=(普通自行车借车次数【g】+电动自行车借车次数【j】)/ 站点公共自行车总数量【a】;因存在站点电动自行车借车次数【j】及普通自行车借车次数【g】存在为0的情况,此时普通自行车平均使用时长【l】与电动自行车平均使用时长【m】计算为0。 (5)数据分析:通过普通自行车、电动自行车的使用时长和借车次数计算该站点公共自行车平均使用时间;通过自行车、电动自行车的借车次数和该站点公共自行车总数量,可以计算该站点公共自行车的平均使用率。若站点公共自行车平均使用率高,可以加大该站点公共自行车运营投放,帮助站点优化布局和运营策略,提高公共自行车资源的利用率和服务质量。
This dataset is developed based on the analysis of public bicycle operation data. By statistically analyzing metrics including usage duration, rental frequency, and consumption amount for conventional bicycles and electric bicycles, the average usage duration and average utilization rate of such vehicles are derived. By examining the utilization rate and revenue of each station, the dispatch of bicycles and electric bicycles at high-demand stations can be enhanced, and the operation strategy of public bicycle systems can be rationally optimized. As a tourist city, Linhai experiences heavy vehicle traffic during holidays, especially severe congestion in its old town. Public bicycles and electric bicycles can provide convenient travel options for tourists. Based on public bicycle usage data at stations during holidays, tourist attractions, local specialty snacks and other Linhai-specific featured products can be recommended at relevant stations, providing travel suggestions for tourists and contributing to a favorable tourism environment. Through data analysis, dense usage of bicycle stations in a specific area can be clearly observed, indicating a large passenger flow in that area, which can provide decision-making basis for commercial site selection in the region. (1) First, anonymize the order data and export the processed order dataset; (2) Clean the exported order data, remove abnormal records, and handle missing values in partial data; (3) Extract metrics such as rental frequency, return frequency, consumption amount, and usage duration for conventional bicycles and electric bicycles at each station on a daily basis from the cleaned data. Specifically: - Usage duration of conventional/electric bicycles: total sum of usage time across all rental orders originating from the station on that day, measured in seconds; - Rental frequency of conventional/electric bicycles: total sum of rental times across all rental orders originating from the station on that day; - Consumption amount of conventional/electric bicycles: total sum of order amounts across all rental orders originating from the station on that day. (4) Data processing: Evaluate the operation data using the following key indicators: - Average usage duration of conventional bicycles [l] = Usage duration of conventional bicycles [f] / Rental frequency of conventional bicycles [g]; - Average usage duration of electric bicycles [m] = Usage duration of electric bicycles [i] / Rental frequency of electric bicycles [j]; - Average utilization rate [n] = (Rental frequency of conventional bicycles [g] + Rental frequency of electric bicycles [j]) / Total number of public bicycles at the station [a]; If the rental frequency of either conventional bicycles [g] or electric bicycles [j] at a station is 0, the average usage duration [l] for conventional bicycles and [m] for electric bicycles shall be calculated as 0. (5) Data analysis: Calculate the average usage duration of public bicycles at the station using the usage duration and rental frequency of conventional and electric bicycles; calculate the average utilization rate of public bicycles at the station using the rental frequency of conventional/electric bicycles and the total number of public bicycles at the station. If the average utilization rate of public bicycles at a station is high, the fleet deployment of public bicycles at this station can be increased, helping optimize the station's layout and operation strategy, and improving the utilization rate of public bicycle resources and service quality.