
DataHub ESG - Free Dataset
收藏Snowflake2024-05-31 更新2024-06-01 收录
下载链接:
https://app.snowflake.com/marketplace/listing/GZT0ZKSMUYI
下载链接
链接失效反馈官方服务:
资源简介:
## Overview
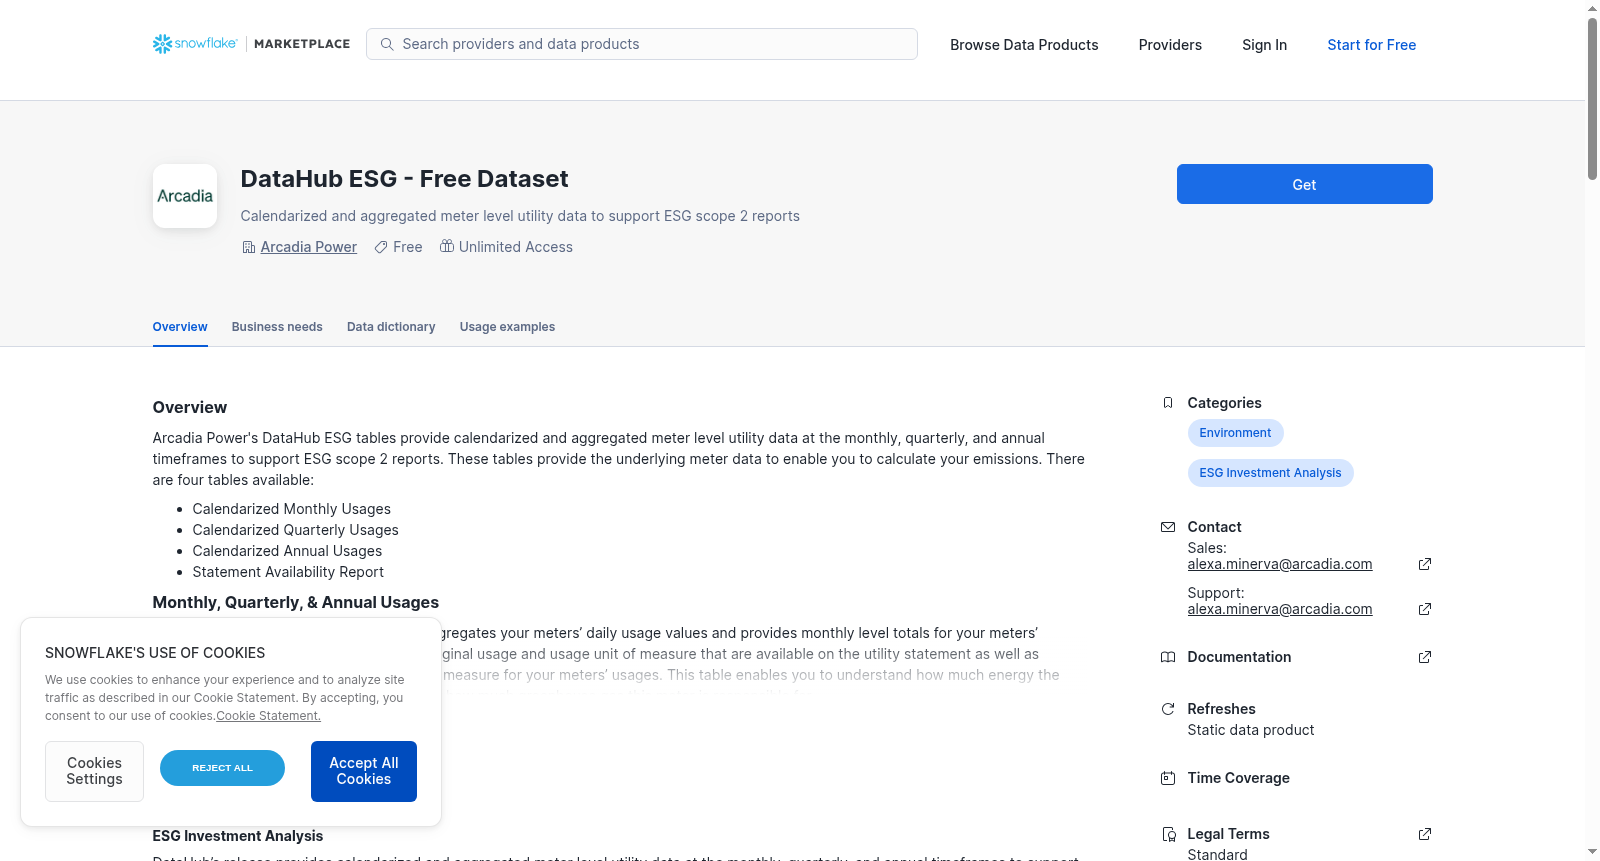
Arcadia Power's DataHub ESG tables provide calendarized and aggregated meter level utility data at the monthly, quarterly, and annual timeframes to support ESG scope 2 reports. These tables provide the underlying meter data to enable you to calculate your emissions. There are four tables available:
- Calendarized Monthly Usages
- Calendarized Quarterly Usages
- Calendarized Annual Usages
- Statement Availability Report
## Monthly, Quarterly, & Annual Usages
The Calendarized Monthly Usages table aggregates your meters’ daily usage values and provides monthly level totals for your meters’ usages. This table provides fields for the original usage and usage unit of measure that are available on the utility statement as well as standardized columns for usage and unit of measure for your meters’ usages. This table enables you to understand how much energy the meter uses for a specific month to calculate how much greenhouse gas this meter is responsible for.
<p><br/></p>
The Calendarized Quarterly Usages and Calendarized Annual Usages tables support this use case as well and offer the meter level data aggregation at the quarterly or annual levels respectively.
<p><br/></p>
## Statement Availability
This listing also provides the Statement Availability Report to present a summary of how many statements are included in your calendarized ESG report. The Statement Availability Report table provides columns for your total statements, statements included into your calendarized ESG report, statements excluded from your calendarized ESG report, and the statements included percentage.
<p><br/></p>
## Sample Data
The sample data available in all tables represents 300 utility meters at the monthly, quarterly, and annual timeframes. For example, if there are 24 months of historical statement data for a given meter, the Calendarized Monthly Table contains 24 records representing the meter's usage per each month.
<p><br/></p>
## Next Steps
To learn more, please visit our [DataHub](https://docs.arcadia.com/docs/datahub-esg-tables-getting-started-guide) and [Plug](https://docs.arcadia.com/docs/dashboard-quick-start-guide) external documentation.
提供机构:
Arcadia Power
创建时间:
2024-05-30
搜集汇总
数据集介绍
背景与挑战
背景概述
该数据集提供月度、季度和年度三个时间维度的标准化能源使用数据表,用于计算ESG范围2排放报告,包含300个公用事业仪表的样本数据。配套的报表可用性摘要可帮助用户快速了解数据覆盖情况。
以上内容由遇见数据集搜集并总结生成



