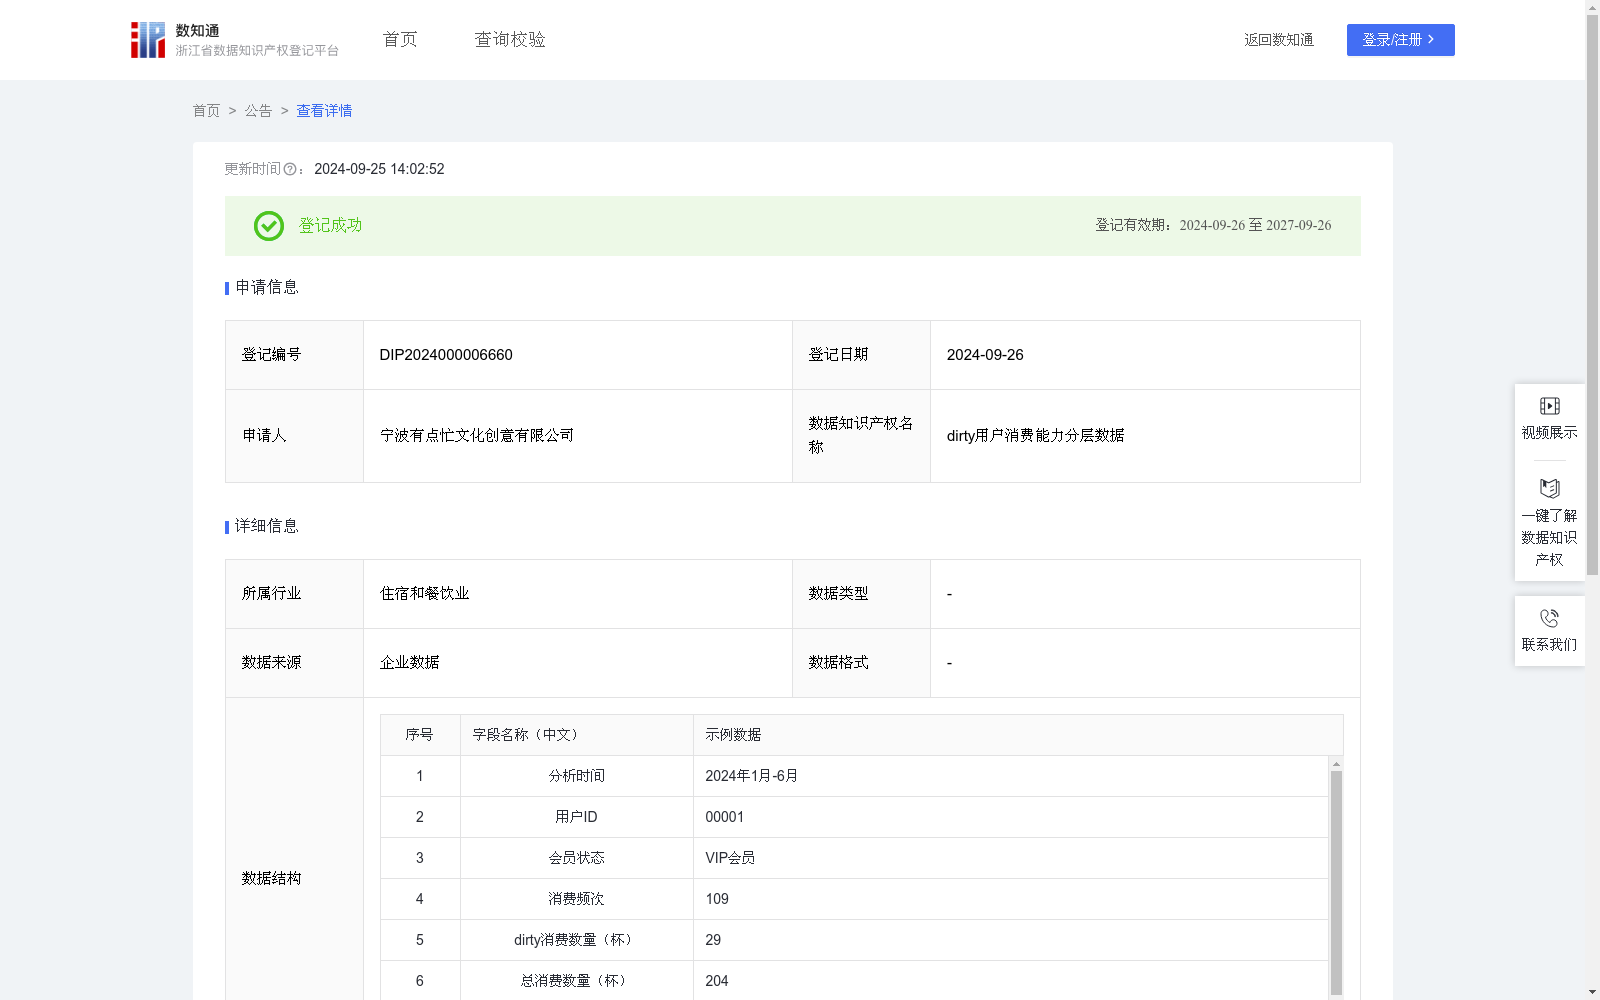
dirty用户消费能力分层数据
收藏资源简介:
基于消费能力分层数据,针对不同层次的用户制定个性化的营销策略。对于高消费能力用户,可推出高端咖啡饮品及定制化服务;对于中等和低消费能力用户,则注重性价比和促销活动的吸引力。应用场景广泛,通过充分利用这些数据资源,企业可以更好地理解用户需求,优化产品和服务,提升市场竞争力。1、数据采集:采集咖啡店管理系统dirty用户消费能力分层数据等信息; 2、数据计算:对采集得到的数据先进行整理处理,总消费数量(杯)是一个用户一段时间内容的全部消费杯数,消费数量(杯)是一个用户具体一款咖啡一段时间内容的消费杯数,对整理后的数据按照如下公式进行计算:dirty消费占比(%)=dirty消费数量(杯)/总消费数量(杯)*100%; 3、数据分析:用户消费能力运用ABCD分类法,对消费占比≥25%的,给予“A类”用户分级;消费占比≥13%<25%的,给予“B类”用户分级;消费占比≥5%<13%区间的,给予“C类”用户分级;消费占比<5%区间的,给予“D类”用户分级; 4、数据应用: 通过对历史下单用户画像建立,对用户进行标签制定,定位用户消费级别,可以为咖啡店消费者广告营销策略提供数据支持,如推出适合消费层级的咖啡饮品及定制化服务。
This dataset is built on consumer spending power tiered data, aiming to formulate personalized marketing strategies for users across different tiers. For high-spending users, premium coffee beverages and customized services can be introduced; for medium and low-spending users, priority should be given to cost-effectiveness and the appeal of promotional activities. The application scenarios are wide-ranging: by making full use of these data resources, enterprises can gain a better understanding of user needs, optimize products and services, and enhance their market competitiveness. 1. Data Collection: Collect information including the consumption power tiering data of users purchasing dirty coffee from coffee shop management systems; 2. Data Calculation: First, organize and process the collected data. Total consumption quantity (cups) refers to the total number of coffee cups consumed by a single user within a specific period, while individual coffee consumption quantity (cups) refers to the number of cups of a specific coffee product consumed by a user within a given period. Calculate the processed data using the following formula: Dirty coffee consumption proportion (%) = (Dirty coffee consumption quantity (cups) / Total consumption quantity (cups)) × 100%; 3. Data Analysis: Classify users' consumption power via the ABCD classification method. Users with a dirty coffee consumption proportion ≥25% are categorized as "Category A"; those with 13% ≤ proportion <25% are categorized as "Category B"; those with 5% ≤ proportion <13% are categorized as "Category C"; and those with a proportion <5% are categorized as "Category D". 4. Data Application: By establishing profiles of historical order-placing users and formulating user tags to locate their consumption tiers, this dataset can provide data support for coffee shops' advertising and marketing strategies, such as launching coffee beverages and customized services tailored to different consumption tiers.