怀来遥感试验站:热红外遥感观测模拟数据集(2023)
收藏国家青藏高原科学数据中心2025-03-07 更新2025-04-26 收录
下载链接:
https://data.tpdc.ac.cn/zh-hans/data/b1b5e798-2141-4bab-8015-453d13ad4fd6
下载链接
链接失效反馈官方服务:
资源简介:
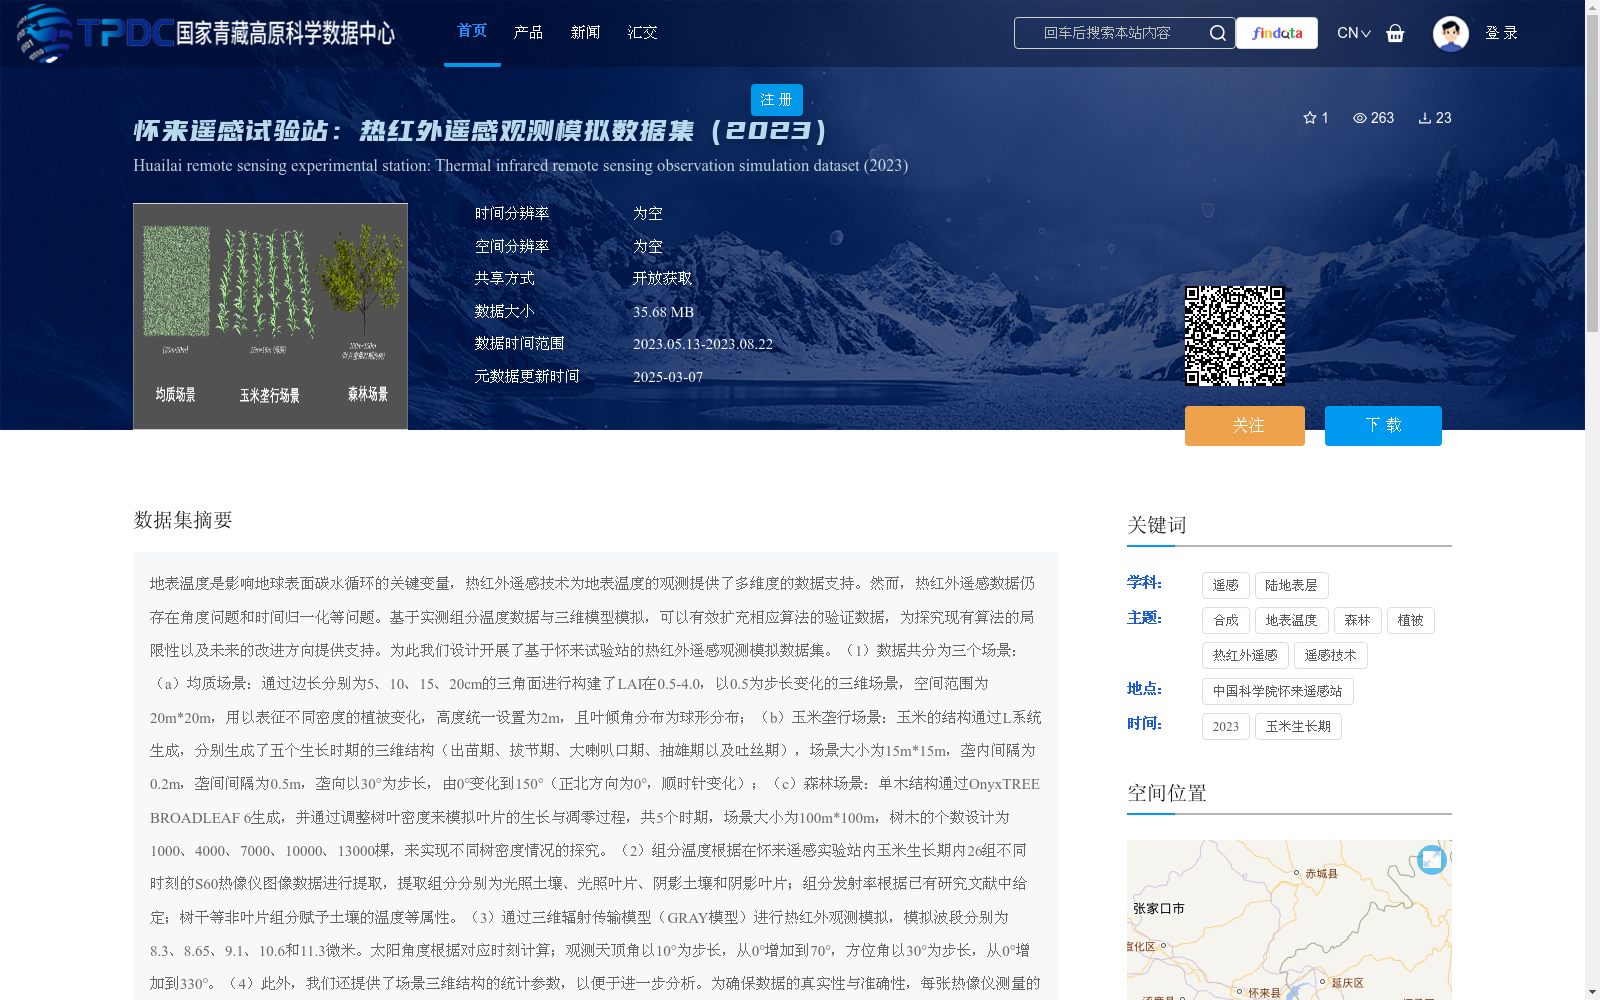
地表温度是影响地球表面碳水循环的关键变量,热红外遥感技术为地表温度的观测提供了多维度的数据支持。然而,热红外遥感数据仍存在角度问题和时间归一化等问题。基于实测组分温度数据与三维模型模拟,可以有效扩充相应算法的验证数据,为探究现有算法的局限性以及未来的改进方向提供支持。为此我们设计开展了基于怀来试验站的热红外遥感观测模拟数据集。(1)数据共分为三个场景:(a)均质场景:通过边长分别为5、10、15、20cm的三角面进行构建了LAI在0.5-4.0,以0.5为步长变化的三维场景,空间范围为20m*20m,用以表征不同密度的植被变化,高度统一设置为2m,且叶倾角分布为球形分布;(b)玉米垄行场景:玉米的结构通过L系统生成,分别生成了五个生长时期的三维结构(出苗期、拔节期、大喇叭口期、抽雄期以及吐丝期),场景大小为15m*15m,垄内间隔为0.2m,垄间间隔为0.5m,垄向以30°为步长,由0°变化到150°(正北方向为0°,顺时针变化);(c)森林场景:单木结构通过OnyxTREE BROADLEAF 6生成,并通过调整树叶密度来模拟叶片的生长与凋零过程,共5个时期,场景大小为100m*100m,树木的个数设计为1000、4000、7000、10000、13000棵,来实现不同树密度情况的探究。(2)组分温度根据在怀来遥感实验站内玉米生长期内26组不同时刻的S60热像仪图像数据进行提取,提取组分分别为光照土壤、光照叶片、阴影土壤和阴影叶片;组分发射率根据已有研究文献中给定;树干等非叶片组分赋予土壤的温度等属性。(3)通过三维辐射传输模型(GRAY模型)进行热红外观测模拟,模拟波段分别为8.3、8.65、9.1、10.6和11.3微米。太阳角度根据对应时刻计算;观测天顶角以10°为步长,从0°增加到70°,方位角以30°为步长,从0°增加到330°。(4)此外,我们还提供了场景三维结构的统计参数,以便于进一步分析。为确保数据的真实性与准确性,每张热像仪测量的组分温度信息均通过同步拍摄的照片进行验证,并经过人工审核。同时,三维辐射传输模型的精度通过实测数据与模拟数据的对比验证,进一步保证了数据的可靠性。具体上,本数据集在三种场景下的各模拟情况分别包括了8320、7800以及6500条,每一条对应85个观测角度的亮度温度,为后续算法的验证与改进提供了翔实的支撑。
Land Surface Temperature (LST) is a critical variable affecting the terrestrial carbon and water cycles. Thermal infrared remote sensing technology provides multi-dimensional data support for LST observation. However, thermal infrared remote sensing data still face challenges such as angular dependence and temporal normalization. Based on in-situ component temperature data and 3D model simulations, the validation dataset for relevant algorithms can be effectively expanded, providing support for exploring the limitations of existing algorithms and future improvement directions. To this end, we developed a thermal infrared remote sensing observation simulation dataset based on the Huailai Experimental Station.
(1) The dataset includes three scenarios:
(a) Homogeneous vegetation scenario: Three-dimensional scenes with a spatial extent of 20 m × 20 m were constructed using triangular facets with side lengths of 5, 10, 15, and 20 cm, respectively. The Leaf Area Index (LAI) ranges from 0.5 to 4.0 with a step size of 0.5, to characterize variations in vegetation density. The vegetation height is uniformly set to 2 m, and the leaf angle distribution follows a spherical distribution.
(b) Maize row scenario: The maize canopy structure was generated using the L-system, and three-dimensional structures for five growth stages (emergence stage, jointing stage, big bell stage, tasseling stage, and silking stage) were developed. The scenario size is 15 m × 15 m, with an intra-row spacing of 0.2 m, inter-row spacing of 0.5 m, and row orientation varying from 0° to 150° with a step size of 30° (0° denotes true north, with clockwise rotation).
(c) Forest scenario: Individual tree structures were generated using OnyxTREE BROADLEAF 6, and the leaf growth and withering processes were simulated by adjusting leaf density, with a total of 5 growth stages. The scenario size is 100 m × 100 m, and the number of trees is set to 1000, 4000, 7000, 10000, and 13000, respectively, to explore different tree density conditions.
(2) Component temperatures were extracted from 26 sets of S60 thermal imager image data collected at different times during the maize growth period at the Huailai Remote Sensing Experimental Station. The extracted components include sunlit soil, sunlit leaves, shaded soil, and shaded leaves. The component emissivities were sourced from existing research literature. Non-leaf components such as tree trunks are assigned temperature and other physical properties of soil.
(3) Thermal infrared observations were simulated using a three-dimensional radiative transfer model (GRAY model). The simulation bands are 8.3, 8.65, 9.1, 10.6, and 11.3 μm. The solar angles were calculated based on the corresponding measurement times; the viewing zenith angle ranges from 0° to 70° with a step size of 10°, and the viewing azimuth angle ranges from 0° to 330° with a step size of 30°.
(4) In addition, we also provide statistical parameters of the 3D scene structures to facilitate further analysis. To ensure the authenticity and accuracy of the data, the component temperature information measured by each thermal imager was verified using synchronously captured photos and manually reviewed. Meanwhile, the accuracy of the 3D radiative transfer model was validated by comparing in-situ measured data and simulated data, further ensuring the reliability of the dataset. Specifically, the simulation cases for the three scenarios include 8320, 7800, and 6500 entries respectively, with each entry corresponding to brightness temperatures at 85 viewing angles, providing solid support for the validation and improvement of subsequent algorithms.
提供机构:
范腾远,卞尊健,鹿一凡,历华,高浩天,曹彪,杜永明,肖青
创建时间:
2025-02-24
搜集汇总
数据集介绍
背景与挑战
背景概述
该数据集包含2023年怀来遥感试验站的热红外遥感观测模拟数据,涵盖均质、玉米垄行和森林三种场景,用于地表温度观测算法的验证与改进。数据以CSV格式存储,包括亮度温度数据集和场景三维结构的统计参数,总大小为35.68 MB。
以上内容由遇见数据集搜集并总结生成


