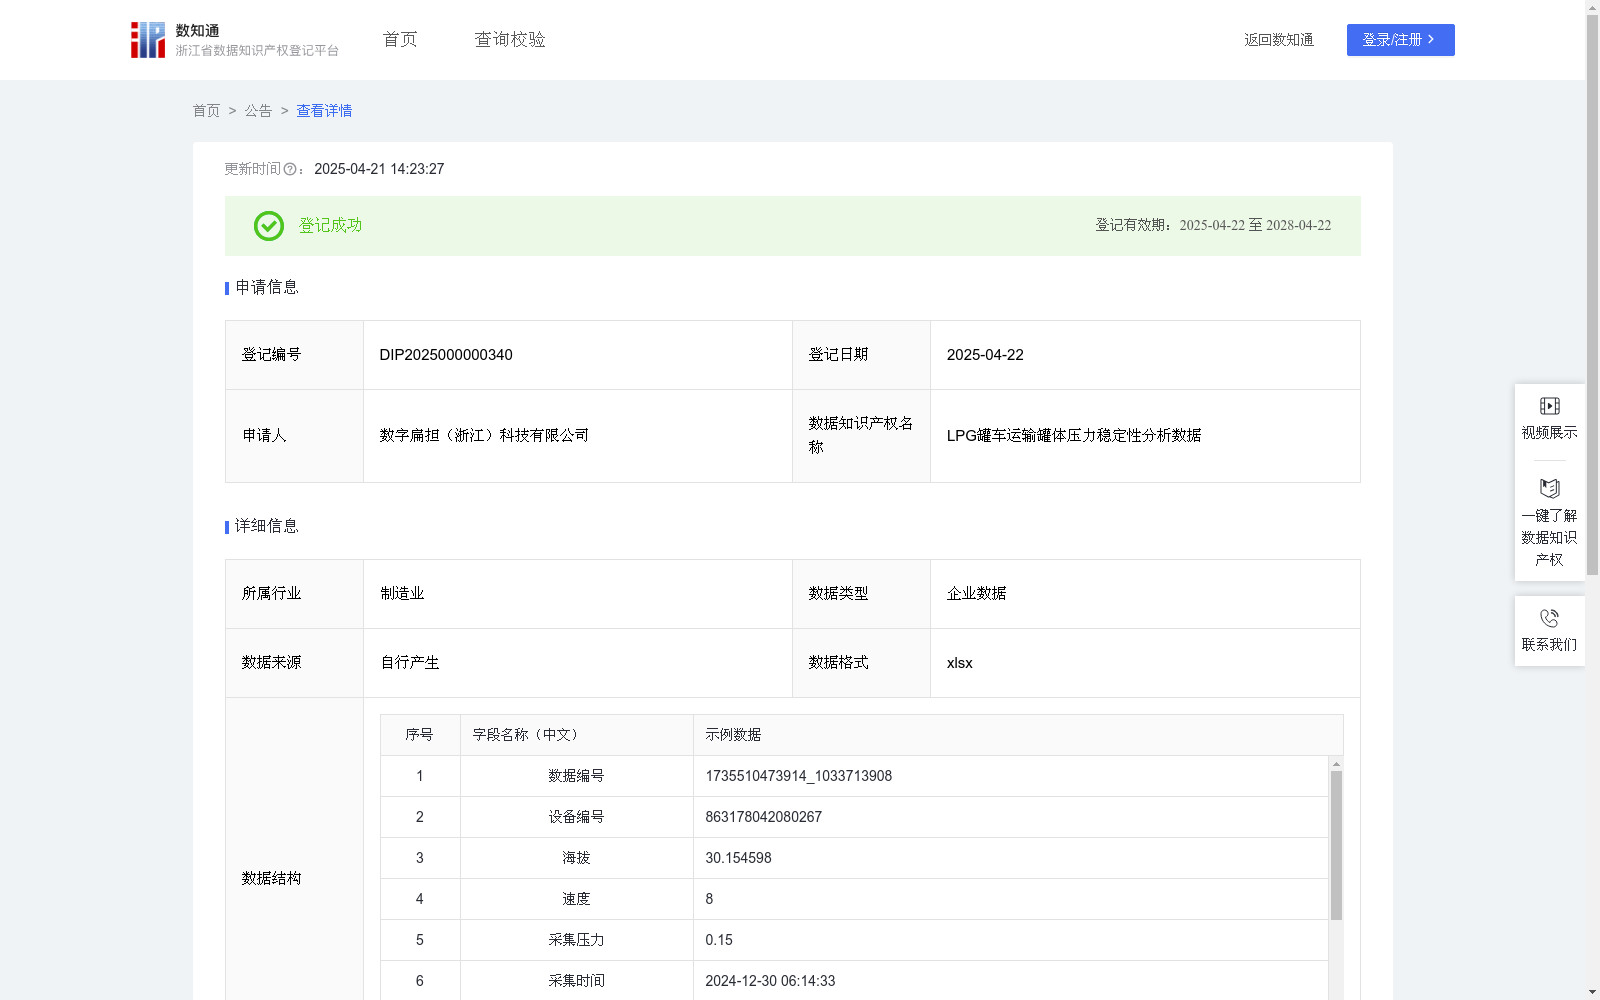
LPG罐车运输罐体压力稳定性分析数据
收藏浙江省数据知识产权登记平台2025-04-21 更新2025-04-22 收录
下载链接:
https://www.zjip.org.cn/home/announce/trends/124998
下载链接
链接失效反馈官方服务:
资源简介:
通过对液化石油气罐车运输时的罐体压力进行稳定性分析,帮助企业了解运输过程中的压力变化趋势,实时掌控罐车运输的安全安防态势。同时,基于时间维度对压力数据进行挖掘,分析压力的变化幅度与时间范围的关系,为罐体设计及制造公司提供第一手的数据参考;基于液化石油气运输过程中不同海拔、不同速度下的压力的变化程度,分析罐体压力与运输安全的相关关系,可以为提供液化石油气运输保险服务的保险公司制定保险产品提供数据参考。此外,该数据也可以为液化石油气行业标准制定提供数据参考,在相关标准制定时提供真实数据的辅助证明。数据采集:将采集设备采集到的罐车速度(千米/小时)、罐车海拔(米)、罐体压力(千帕斯卡)、采集时间等数据进行统一归集,数据采集频率为15秒。数据处理:对数据进行初步清洗加工,得到2024年12月30日6时14分33秒-2024年12月30日8时49分55秒的共538条数据。算法加工:以30分钟为一个时间区间,首先计算得到半小时内的平均压力并计算半小时内压力的标准差。然后根据公式:标准差 / 平均值 得到这一时间区间的压力波动系数,若该值∈(2,+∞),说明压力波动极大,若该值∈(1,2],说明压力波动较大,若该值∈(0,1],说明压力波动较小。最后,利用统计学中的四分位数来判断压力是否出现了异常,通过公式:IQR = Q3 − Q1,第三四分位数减去第一四分位数
计算得到半小时内压力的四分位距iqr。
然后判断压力是否位于[Q1 - 1.5*iqr, Q3 + 1.5*iqr]的区间内,若压力不处于该区间则判断为异常值。
First, stability analysis of tank pressure during liquefied petroleum gas (LPG) tank truck transportation is conducted to help enterprises grasp pressure change trends during transit and monitor the safety and security situation of tank truck transportation in real time. Meanwhile, pressure data is mined based on the time dimension to analyze the relationship between pressure change amplitude and time range, providing first-hand data references for tank design and manufacturing companies. Additionally, by examining the degree of pressure changes under different altitudes and speeds during LPG transportation, the correlation between tank pressure and transportation safety is analyzed, providing data references for insurance companies offering LPG transportation insurance services to develop insurance products. Furthermore, this dataset can also provide data references and supporting real-world data evidence for the formulation of LPG industry standards.
Data Collection: Collected data including tank truck speed (km/h), tank altitude (m), tank pressure (kPa), and collection timestamp are uniformly aggregated. The data collection frequency is set to 15 seconds.
Data Preprocessing: Preliminary cleaning and processing are performed on the collected data, resulting in a total of 538 valid data points spanning from 06:14:33 on December 30, 2024 to 08:49:55 on December 30, 2024.
Algorithm Processing: A 30-minute time interval is adopted as the analysis unit. First, the average pressure and standard deviation of pressure within each 30-minute interval are calculated. The pressure fluctuation coefficient for the interval is then obtained using the formula: standard deviation / average pressure. If the coefficient belongs to (2, +∞), the pressure fluctuation is extreme; if it belongs to (1, 2], the fluctuation is moderate-to-high; if it belongs to (0, 1], the fluctuation is slight. Finally, quartiles in statistics are used to detect abnormal pressure values. The interquartile range (IQR) within each 30-minute interval is calculated via the formula: IQR = Q3 − Q1, where Q3 represents the third quartile and Q1 represents the first quartile. Pressure values are then judged as outliers if they fall outside the interval [Q1 − 1.5*IQR, Q3 + 1.5*IQR].
提供机构:
数字扁担(浙江)科技有限公司
创建时间:
2025-01-17
搜集汇总
数据集介绍
背景与挑战
背景概述
该数据集包含540条LPG罐车运输过程中的罐体压力数据,每日更新,数据格式为xlsx。通过分析罐体压力与运输安全的相关关系,为罐体设计、制造公司、保险公司及行业标准制定提供数据参考。算法规则包括数据采集、初步清洗加工和算法加工,以30分钟为一个时间区间计算压力波动系数和异常判断。
以上内容由遇见数据集搜集并总结生成


