数字门店用户行为监测与精准画像数据
收藏浙江省数据知识产权登记平台2024-10-10 更新2024-10-11 收录
下载链接:
https://www.zjip.org.cn/home/announce/trends/68893
下载链接
链接失效反馈官方服务:
资源简介:
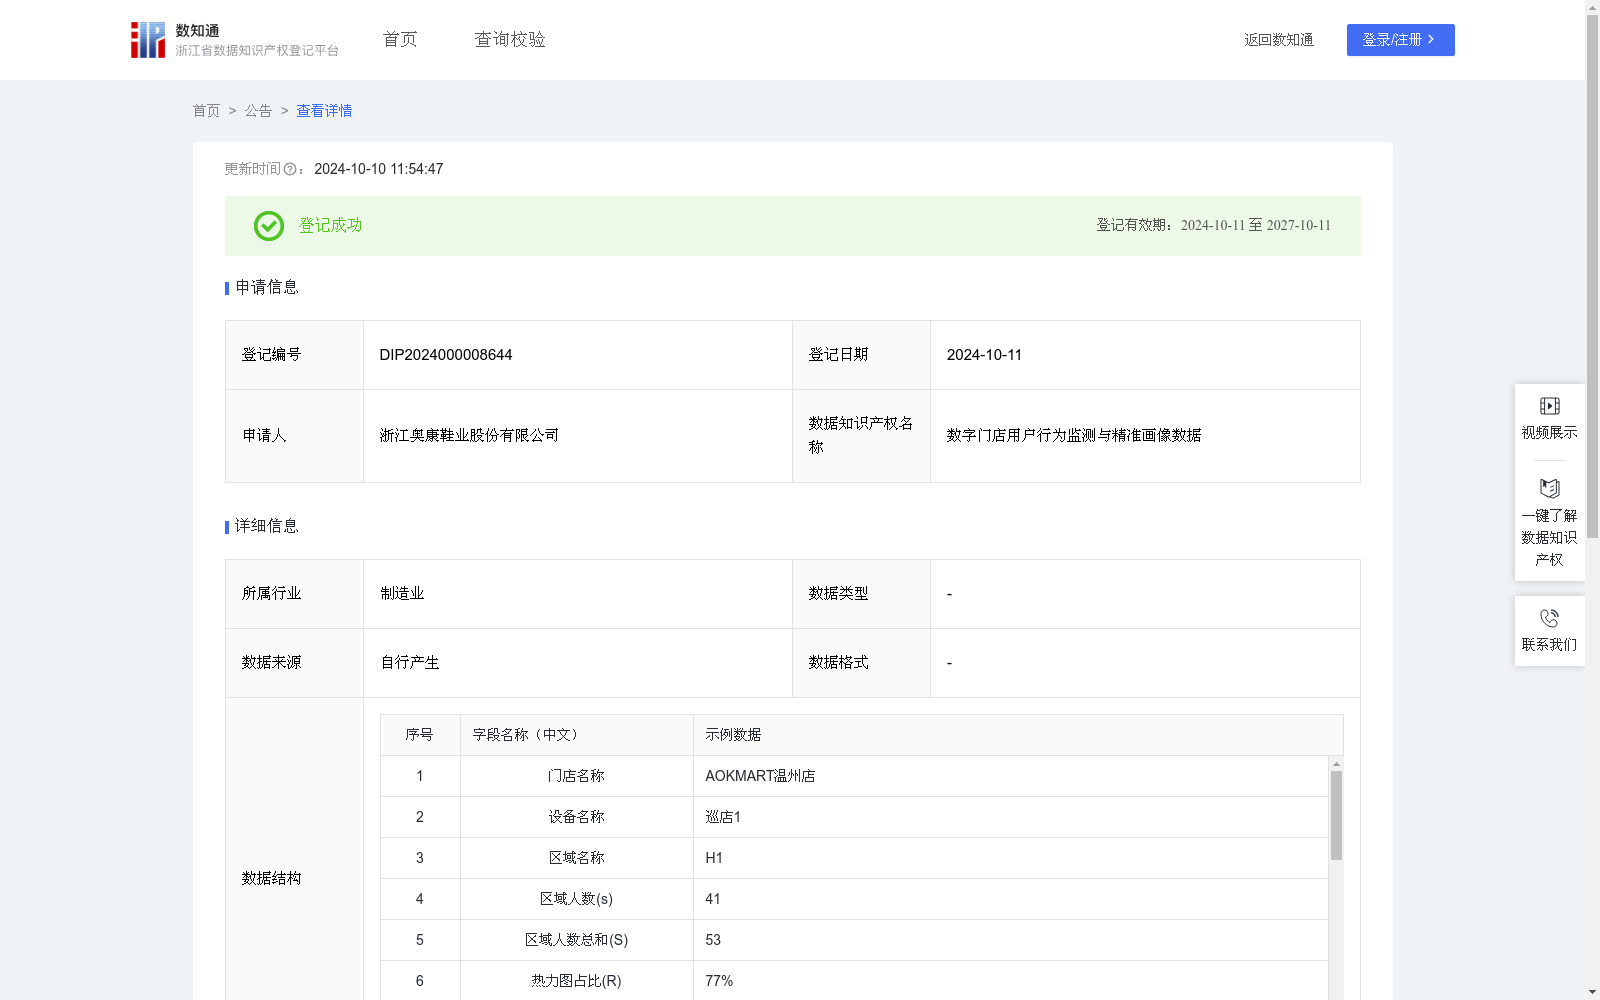
一、利用设备AI智能识别技术优化店内顾客体验与销售策略 1. 精准监测顾客入店与驻留时长:通过部署先进的AI识别系统,精确捕捉顾客进店时刻及在店内的驻留时间,为门店运营提供基础数据支持。 2. 绘制顾客热度区域图:基于AI分析,绘制店内顾客活动热点图,明确哪些区域更受顾客青睐,为商品布局优化提供科学依据。 3. 动态调整商品陈列:依据系统生成的数据分析报告,灵活调整不同时间段、不同区域的商品陈列策略,确保热门商品获得最佳曝光位置,有效提升销售转化率与热门商品的市场占有率。 二、奥康公司自研APP(数字门店)赋能零售升级 1. 增强顾客引流与转化策略:依托门店客流大数据,精准分析顾客行为模式,制定个性化营销策略,如定向推送优惠信息、智能推荐商品等,以提升顾客入店率及消费转化率。同时,通过优化购物体验,鼓励顾客增加购买量,提高客单价。 2. 商品秀专区:高效推广产品亮点:设立商品秀功能模块,集中展示商品的核心卖点与特色,便于门店员工快速掌握产品信息,实现精准推销,增强顾客购买意愿。 3. 全国库存共享:实现无缝供应链管理:实现全国库存信息的实时查询与共享,有效避免因库存不足导致的顾客流失一个设备名称就是一个视频采集设备,每个视频采集设备会划分1个到多个区域名称。 1、数据采集与预处理 使用智能视频采集设备(数据结构中的设备名称)对视频区域范围(数据结构中的区域名称)内进行区域划分(如入口、收银台、中台等命名为H1、H2、H3…)进行数据采集。 利用AI技术识别顾客在划定区域内的行为数据,包括进入和离开的时间等。 2、算法逻辑 设置5秒停留统计阈值,顾客进入指定区域名称后,将停留时间大于等于30秒和小于30秒的人数做好标记绘制在区域图表上。 每个设备名称下的区域名称为H1、H2、H3…, 所对应的区域人数为s1、s2、s3…,区域人数总和为S(S=s1+s2+s3…)。 热力图占比为R(R1=s1/S,R2=s2/S…)得出每个区域的占比数据; R>=70%时热力图为红色,70%>R>=30%<时热力图为黄色,R<=30%时热力图为蓝色。 3、数据应用 门店同事在数字门店APP根据推送数据和结果进行调整产品陈列布局。 通过数字门店APP商品秀功能实时、快速获取热销产品和主推产品的商品核心卖点功能,有效提升销售转化率。
1. Optimizing In-store Customer Experience and Sales Strategies via Device-based AI Intelligent Recognition Technology
1.1 Accurate Monitoring of Customer Entry and Dwell Time: Deploy advanced AI recognition systems to precisely capture customers' entry timestamps and in-store dwell durations, providing basic data support for store operations.
1.2 Generation of Customer Activity Heatmap: Conduct AI-powered analysis to generate in-store customer activity heatmaps, identifying high-preference areas to offer scientific basis for optimizing product layout.
1.3 Dynamic Product Display Adjustment: Flexibly adjust product display strategies across different time periods and areas based on the system-generated data analysis reports, ensuring popular products gain optimal exposure positions, effectively improving sales conversion rates and the market share of popular products.
2. Empowering Retail Upgrade with Aokang Company's Self-developed APP (Digital Store)
2.1 Enhancing Customer Attraction and Conversion Strategies: Rely on in-store foot traffic big data to accurately analyze customer behavior patterns and formulate personalized marketing strategies, such as targeted push of promotional information and intelligent product recommendation, to boost customer in-store rate and consumption conversion rate. Meanwhile, optimize the shopping experience to encourage customers to increase purchase volume and raise average transaction value (ATV).
2.2 Product Showcase Section: Efficiently Promote Product Highlights: Establish a Product Showcase functional module to centrally display the core selling points and features of products, enabling store staff to quickly master product information, achieve precise sales pitches, and enhance customers' purchase willingness.
2.3 National Inventory Sharing: Achieve Seamless Supply Chain Management: Realize real-time inquiry and sharing of national inventory information, effectively avoiding customer churn caused by stockouts.
Note: Each device name corresponds to one video capture device, and each video capture device is divided into 1 to multiple zone names.
1. Data Collection and Preprocessing
Use intelligent video capture devices (device names in the data structure) to collect data within the designated video zones (zone names in the data structure), with zones such as entrance, checkout counter, central area named H1, H2, H3...
Leverage AI technology to identify customers' behavioral data within the designated zones, including entry and exit timestamps.
2. Algorithm Logic
Set a 5-second dwell time statistical threshold. After customers enter the designated zones, count and mark the number of customers with dwell time ≥30 seconds and the number with dwell time <30 seconds, then plot the marked data on the zone chart.
The zone names under each device name are H1, H2, H3..., with corresponding zone visitor counts s1, s2, s3..., and the total number of visitors across all zones is S (S = s1 + s2 + s3 + ...).
Calculate the heatmap proportion R for each zone: R1 = s1/S, R2 = s2/S, etc. The color of the heatmap is determined as follows: red when R ≥ 70%, yellow when 30% ≤ R < 70%, and blue when R ≤ 30%.
3. Data Application
Store staff adjust the product display layout based on the pushed data and analysis results via the Digital Store APP.
Access real-time core selling points of hot-selling and main-promoted products through the Product Showcase function of the Digital Store APP, effectively improving sales conversion rates.
提供机构:
浙江奥康鞋业股份有限公司
创建时间:
2024-09-12
搜集汇总
数据集介绍
以上内容由遇见数据集搜集并总结生成


