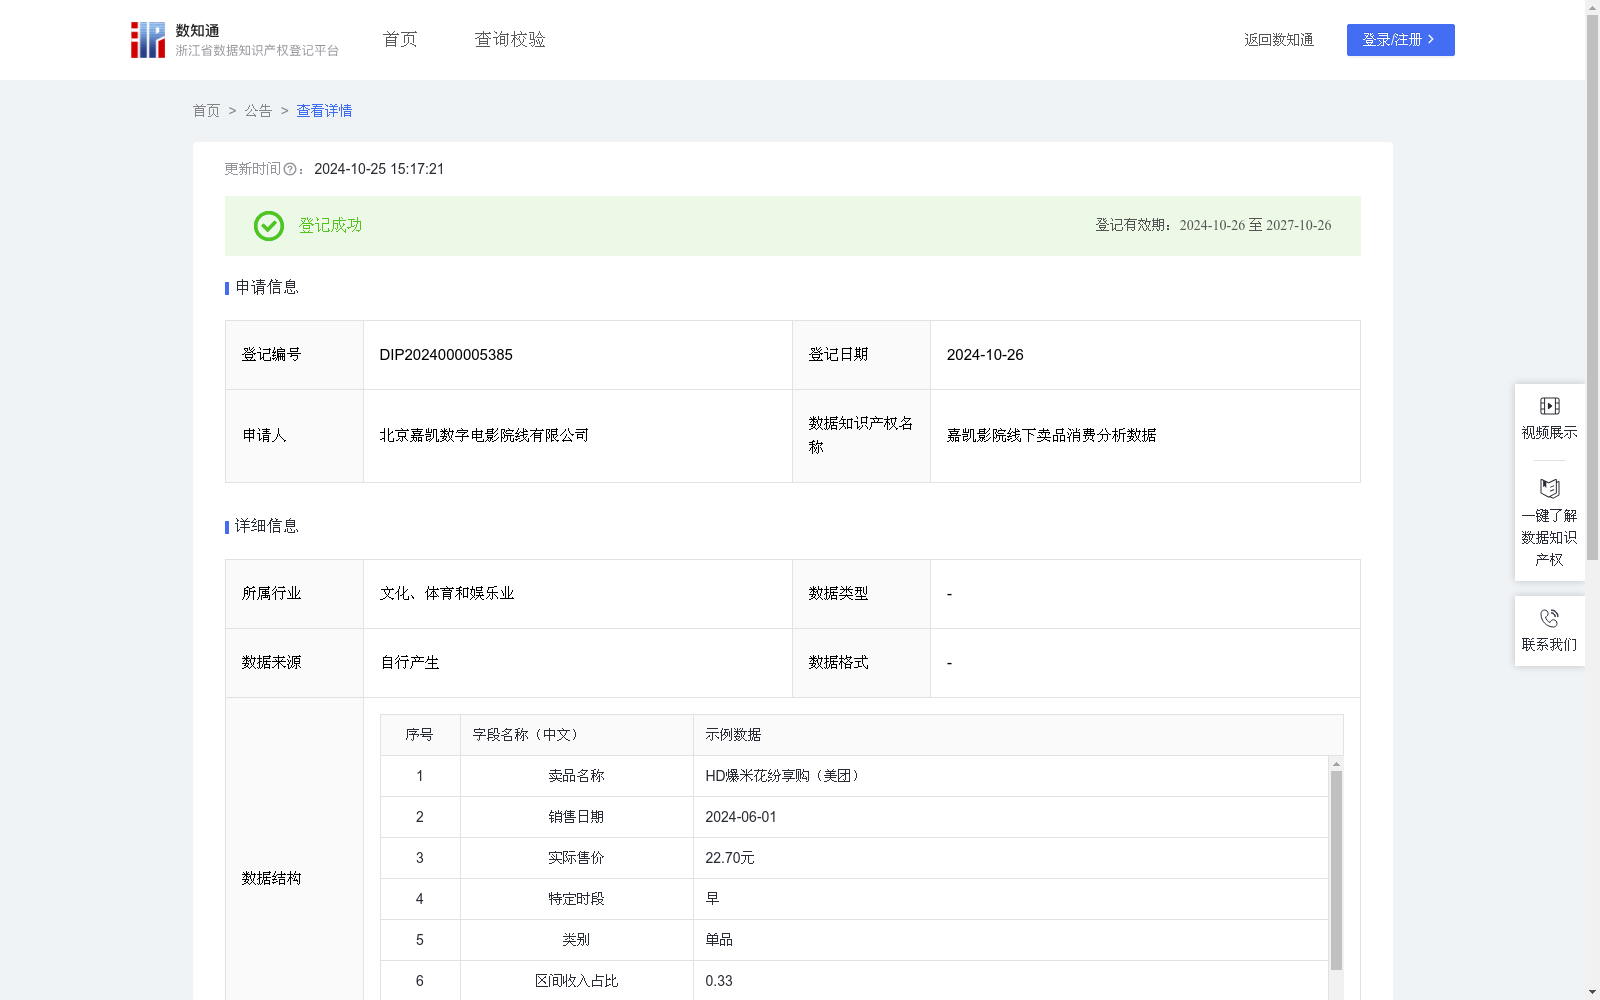
嘉凯影院线下卖品消费分析数据
收藏浙江省数据知识产权登记平台2024-10-25 更新2024-10-26 收录
下载链接:
https://www.zjip.org.cn/home/announce/trends/75750
下载链接
链接失效反馈官方服务:
资源简介:
区间收入占比作为电影院经营中重要的卖品决策依据,可从多方面分析提升电影院线线下卖品业务的经营效率,通过识别品类价格和消费需求的契合度,来动态调整卖品的选品和库存规划,找出畅销和滞销产品,做出更好的营销和库存安排。1.算法处理:将线下卖品按照价格归为四类,即<=30为单品,30-40元(包含40元)为非衍生品包材套餐,40-50元(包含50元)为衍生品包材套餐,>50元为非包材类衍生品,特定时间段内卖品销售总金额为T,特定时段内四类商品销售收入分别为S1、S2、S3、S4,卖品价格区间占比P=指定价格区间卖品销售金额/卖品销售总金额,即P=S/T。特定时段内四类卖品区间收入占比分别则为P1=S1/T、P2=S2/T、P3=S3/T、P4=S4/T。2.结果分析:若其中P≤0.25,反应该价格区间类商品销售收欢迎程度低,P值越低反应该区间商品与卖品实际消费需求和水平越不匹配。若0.25<P≤0.5,则反应该价格区间商品受欢迎度较为正常,若P>0.5,则反应该价格区间商品与所在地消费需求和水平匹配度非常高,应加大该区间段位的选品和套餐开发和相关商品库存备货,满足顾客消费需求;3.算法应用:通过分析P值变动趋势,分析相关指标变化的原因从而改进相关销售管理策略和库存策略,最终提升卖品综合收益。
Revenue proportion of price intervals serves as a key basis for concession decision-making in cinema operations. It can be used to analyze multiple dimensions to improve the operational efficiency of offline concession businesses for cinema chains. By identifying the alignment between product prices and consumer demand, cinemas can dynamically adjust concession product selection and inventory planning, identify best-selling and slow-moving products, and develop more effective marketing and inventory arrangements.
1. Algorithm Processing:
Offline concession products are classified into four categories based on price: single-item products with price ≤30 yuan, non-merchandise packaging combo sets priced between 30–40 yuan (inclusive of 40 yuan), merchandise packaging combo sets priced between 40–50 yuan (inclusive of 50 yuan), and non-packaging merchandise priced >50 yuan. Let T denote the total concession sales revenue over a specific time period, and S1, S2, S3, S4 represent the sales revenues of the four product categories during this period respectively. The revenue proportion of a given price interval P is defined as the sales revenue of concession products in that interval divided by the total concession sales revenue, i.e., P = S/T. The revenue proportions of the four price interval categories during the specific time period are thus P1=S1/T, P2=S2/T, P3=S3/T, and P4=S4/T respectively.
2. Result Analysis:
If P ≤ 0.25, this indicates low popularity of the products in this price interval; the lower the P value, the poorer the alignment between the products in this interval and the actual consumer demand and purchasing power level. If 0.25 < P ≤ 0.5, this indicates moderate popularity of the products in this price interval. If P > 0.5, this indicates extremely high alignment between the products in this interval and the local consumer demand and purchasing power level, and cinemas should increase product selection, combo set development, and inventory stocking for products in this price interval to meet consumer demand.
3. Algorithm Application:
By analyzing the changing trends of the P values and identifying the causes of changes in relevant indicators, cinemas can optimize their sales management and inventory strategies, ultimately improving the overall concession revenue.
提供机构:
北京嘉凯数字电影院线有限公司
创建时间:
2024-08-09
搜集汇总
数据集介绍
特点
该数据集包含嘉凯影院线下卖品的详细销售数据,用于分析卖品受欢迎程度和价格区间占比,帮助优化选品和库存管理。数据每日更新,规模为36233条,适用于提升电影院线线下卖品业务的经营效率。
以上内容由遇见数据集搜集并总结生成


