
Controlled Anomalies Time Series (CATS) Dataset
收藏Mendeley Data2024-05-10 更新2024-06-27 收录
下载链接:
https://zenodo.org/records/8338435
下载链接
链接失效反馈官方服务:
资源简介:
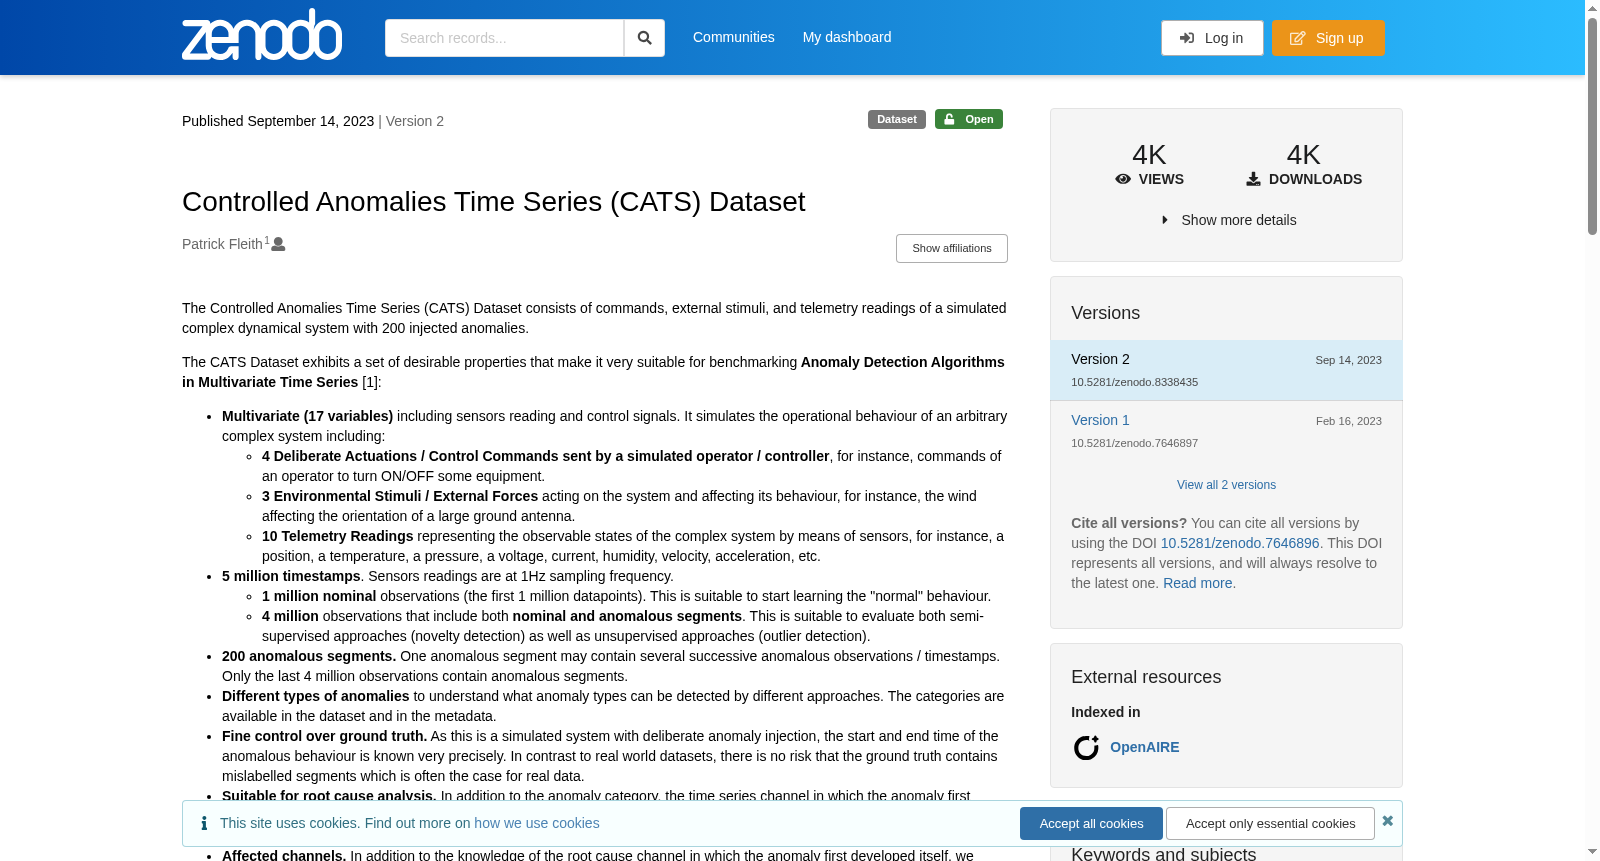
The Controlled Anomalies Time Series (CATS) Dataset consists of commands, external stimuli, and telemetry readings of a simulated complex dynamical system with 200 injected anomalies. The CATS Dataset exhibits a set of desirable properties that make it very suitable for benchmarking Anomaly Detection Algorithms in Multivariate Time Series [1]: Multivariate (17 variables) including sensors reading and control signals. It simulates the operational behaviour of an arbitrary complex system including: 4 Deliberate Actuations / Control Commands sent by a simulated operator / controller, for instance, commands of an operator to turn ON/OFF some equipment. 3 Environmental Stimuli / External Forces acting on the system and affecting its behaviour, for instance, the wind affecting the orientation of a large ground antenna. 10 Telemetry Readings representing the observable states of the complex system by means of sensors, for instance, a position, a temperature, a pressure, a voltage, current, humidity, velocity, acceleration, etc. 5 million timestamps. Sensors readings are at 1Hz sampling frequency. 1 million nominal observations (the first 1 million datapoints). This is suitable to start learning the "normal" behaviour. 4 million observations that include both nominal and anomalous segments. This is suitable to evaluate both semi-supervised approaches (novelty detection) as well as unsupervised approaches (outlier detection). 200 anomalous segments. One anomalous segment may contain several successive anomalous observations / timestamps. Only the last 4 million observations contain anomalous segments. Different types of anomalies to understand what anomaly types can be detected by different approaches. The categories are available in the dataset and in the metadata. Fine control over ground truth. As this is a simulated system with deliberate anomaly injection, the start and end time of the anomalous behaviour is known very precisely. In contrast to real world datasets, there is no risk that the ground truth contains mislabelled segments which is often the case for real data. Suitable for root cause analysis. In addition to the anomaly category, the time series channel in which the anomaly first developed itself is recorded and made available as part of the metadata. This can be useful to evaluate the performance of algorithm to trace back anomalies to the right root cause channel. Affected channels. In addition to the knowledge of the root cause channel in which the anomaly first developed itself, we provide information of channels possibly affected by the anomaly. This can also be useful to evaluate the explainability of anomaly detection systems which may point out to the anomalous channels (root cause and affected). Obvious anomalies. The simulated anomalies have been designed to be "easy" to be detected for human eyes (i.e., there are very large spikes or oscillations), hence also detectable for most algorithms. It makes this synthetic dataset useful for screening tasks (i.e., to eliminate algorithms that are not capable to detect those obvious anomalies). However, during our initial experiments, the dataset turned out to be challenging enough even for state-of-the-art anomaly detection approaches, making it suitable also for regular benchmark studies. Context provided. Some variables can only be considered anomalous in relation to other behaviours. A typical example consists of a light and switch pair. The light being either on or off is nominal, the same goes for the switch, but having the switch on and the light off shall be considered anomalous. In the CATS dataset, users can choose (or not) to use the available context, and external stimuli, to test the usefulness of the context for detecting anomalies in this simulation. Pure signal ideal for robustness-to-noise analysis. The simulated signals are provided without noise: while this may seem unrealistic at first, it is an advantage since users of the dataset can decide to add on top of the provided series any type of noise and choose an amplitude. This makes it well suited to test how sensitive and robust detection algorithms are against various levels of noise. No missing data. You can drop whatever data you want to assess the impact of missing values on your detector with respect to a clean baseline. Change Log Version 2 Metadata: we include a metadata.csv with information about: Anomaly categories Root cause channel (signal in which the anomaly is first visible) Affected channel (signal in which the anomaly might propagate) through coupled system dynamics Removal of anomaly overlaps: version 1 contained anomalies which overlapped with each other resulting in only 190 distinct anomalous segments. Now, there are no more anomaly overlaps. Two data files: CSV and parquet for convenience. [1] Example Benchmark of Anomaly Detection in Time Series: “Sebastian Schmidl, Phillip Wenig, and Thorsten Papenbrock. Anomaly Detection in Time Series: A Comprehensive Evaluation. PVLDB, 15(9): 1779 - 1797, 2022. doi:10.14778/3538598.3538602” About Solenix Solenix is an international company providing software engineering, consulting services and software products for the space market. Solenix is a dynamic company that brings innovative technologies and concepts to the aerospace market, keeping up to date with technical advancements and actively promoting spin-in and spin-out technology activities. We combine modern solutions which complement conventional practices. We aspire to achieve maximum customer satisfaction by fostering collaboration, constructivism, and flexibility.
受控异常时间序列(Controlled Anomalies Time Series, CATS)数据集包含一个模拟复杂动态系统的指令、外部刺激与遥测读数,共注入200处异常。CATS数据集具备多项理想特性,非常适合作为多元时间序列异常检测算法的基准测试数据集[1]:
该数据集为多元结构(含17个变量),涵盖传感器读数与控制信号。其模拟了任意复杂系统的运行行为,具体包含:四类由模拟操作员或控制器发出的主动操控/控制指令,例如操作员下达的某设备启停指令;三类作用于系统并影响其运行状态的环境刺激/外部作用力,例如影响大型地面天线朝向的风力;十类通过传感器获取的、表征复杂系统可观测状态的遥测读数,例如位置、温度、压力、电压、电流、湿度、速度、加速度等。
数据集共包含500万个时间戳,传感器读数采样频率为1Hz。其中前100万个数据点为正常观测样本,可用于学习系统的"正常"运行行为。剩余400万个观测样本同时包含正常与异常片段,可用于评估半监督方法(新颖性检测,novelty detection)与无监督方法(离群点检测,outlier detection)两类异常检测方案。
数据集共包含200处异常片段,单处异常片段可包含多个连续的异常观测样本/时间戳,且异常片段仅存在于后400万个观测样本中。
数据集涵盖多种异常类型,便于研究不同检测方法可识别的异常类别,异常类别信息已随数据集一同提供于元数据中。此外,该数据集可实现对真实标签(ground truth)的精细控制。由于该数据集基于模拟系统且为蓄意注入异常,异常行为的起止时间可被精准获知。与真实世界数据集不同,其真实标签不存在标注错误的风险——而标注错误是真实数据集中的常见问题。
该数据集也适用于根因分析任务:除异常类别外,异常首次出现的时间序列通道信息也已随元数据一同提供,可用于评估算法将异常追溯至正确根因通道的性能。此外,数据集还提供异常可能波及的通道信息。结合异常首次出现的根因通道信息,该内容可用于评估异常检测系统的可解释性——此类系统通常需定位异常通道(包括根因通道与波及通道)。
异常样本具备直观性:模拟异常被设计为便于人类肉眼识别的类型(即存在大幅尖峰或振荡),因此多数算法也可轻松检测到这类异常。这使得该合成数据集可用于算法筛选任务——例如淘汰无法检测此类明显异常的算法。但在初始实验中,该数据集对当前前沿的异常检测方法仍具备足够挑战性,因此也适用于常规基准测试研究。
数据集提供上下文关联信息:部分变量的异常性需结合其他系统行为判定。典型示例为灯具与开关组合:灯具单独开启或关闭均为正常状态,开关单独开启或关闭也为正常状态,但开关开启而灯具关闭则属于异常状态。在CATS数据集中,用户可自主选择是否利用提供的上下文信息与外部刺激,以验证上下文信息在该模拟场景下对异常检测的辅助效果。
数据集提供纯净信号,非常适合用于抗噪性分析:模拟信号未添加任何噪声。尽管初看这似乎不符合实际,但该设计具备显著优势——数据集使用者可自主为原始时序序列添加任意类型与幅度的噪声,因此非常适合用于评估检测算法对不同强度噪声的敏感性与鲁棒性。
数据集无缺失值:使用者可自行删除任意数据,以基于干净的原始基准评估缺失值对检测算法的影响。
版本2更新日志与元数据:本次发布附带metadata.csv文件,其中包含以下信息:异常类别、异常首次出现的根因通道(即异常最早可被观测到的信号)、异常通过系统耦合动力学可能波及的波及通道。此外,版本1中存在异常片段重叠的问题,导致仅存在190处独立的异常片段,而版本2已彻底消除了异常重叠的情况。
为便于使用,数据集同时提供CSV与Parquet两种格式的数据文件。
[1] 时间序列异常检测基准测试示例:Sebastian Schmidl、Phillip Wenig与Thorsten Papenbrock. 时间序列异常检测:全面评估. PVLDB, 15(9): 1779-1797, 2022. DOI:10.14778/3538598.3538602
关于索莱尼克斯(Solenix):索莱尼克斯是一家为航天市场提供软件工程、咨询服务与软件产品的国际化企业。作为一家充满活力的公司,其始终紧跟技术发展前沿,为航空航天市场引入创新技术与理念,并积极推动技术引进与输出活动。公司将现代解决方案与传统实践相结合,通过倡导协作、务实与灵活的工作理念,致力于为客户带来最高程度的满意度。
创建时间:
2023-09-20
搜集汇总
数据集介绍
背景与挑战
背景概述
CATS数据集是一个包含500万时间戳、17个变量的合成多变量时间序列数据集,专门设计用于异常检测算法基准测试。该数据集包含200个精确标注的异常段,具有无噪声、无缺失值的特点,并提供了异常类别、根因通道等元数据,适合评估算法在异常检测和根因分析方面的性能。
以上内容由遇见数据集搜集并总结生成



