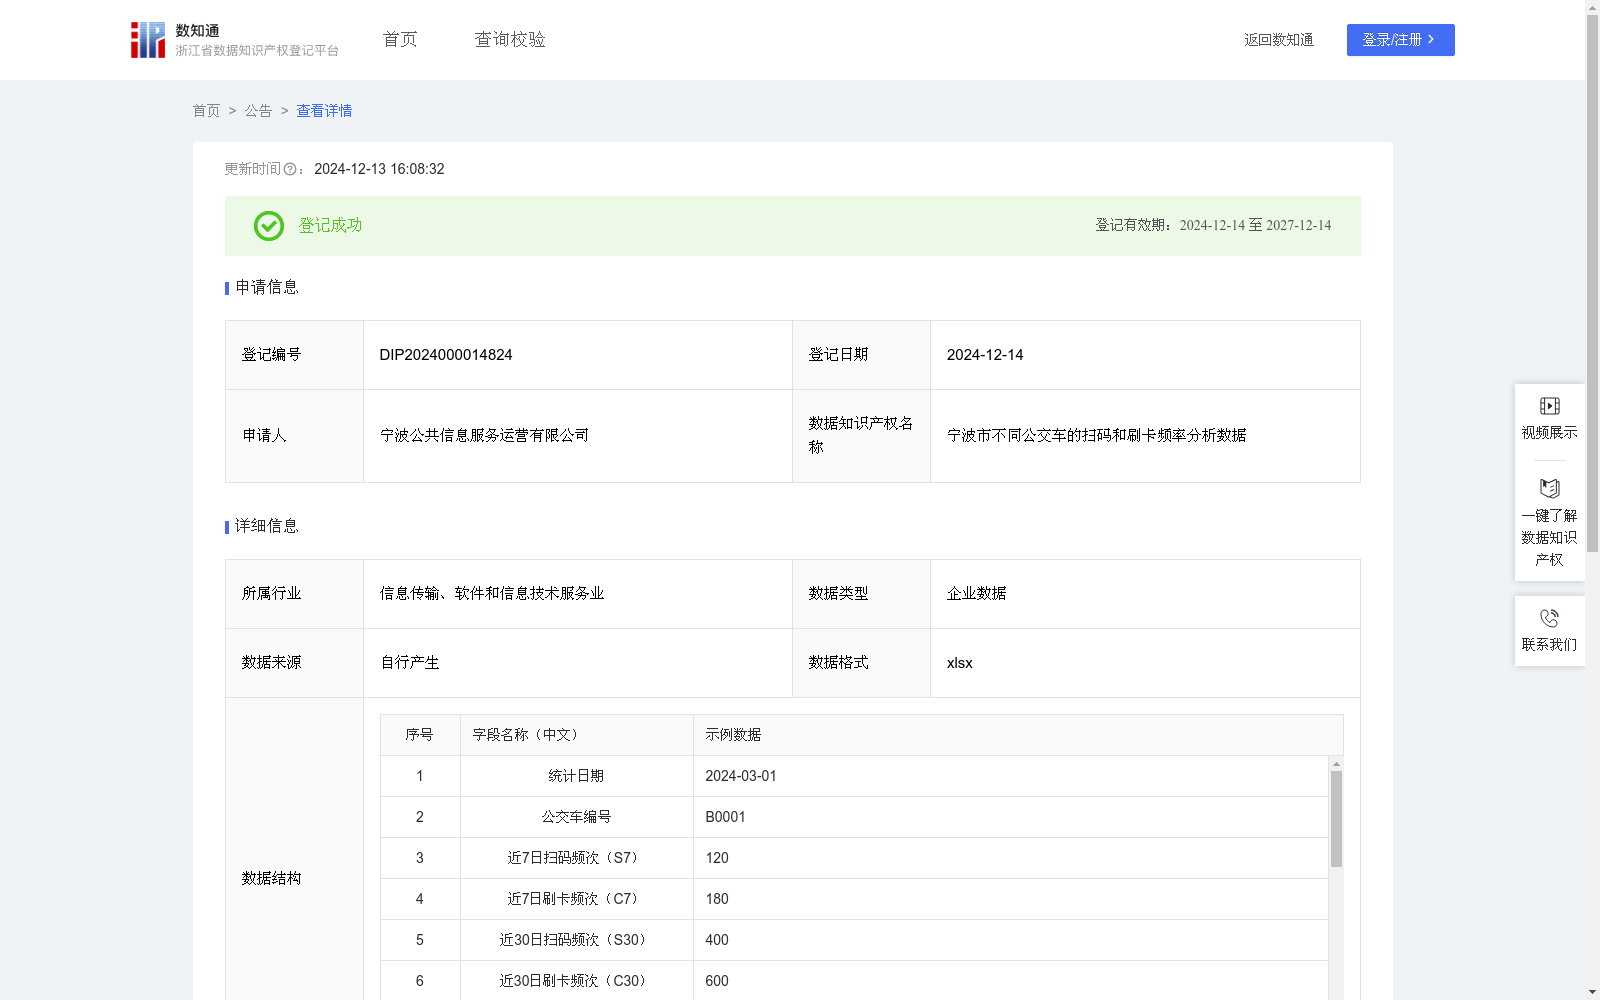
宁波市不同公交车的扫码和刷卡频率分析数据
收藏浙江省数据知识产权登记平台2024-12-13 更新2024-12-14 收录
下载链接:
https://www.zjip.org.cn/home/announce/trends/103793
下载链接
链接失效反馈官方服务:
资源简介:
由于宁波市公交车的乘客基本上都是通过扫码和刷卡的方式进行乘车付费,通过分析不同公交车的扫码和刷卡频率及趋势情况能一定程度反映公交车的乘客流量情况及趋势,并基于此合理分配车辆和人力资源,为路线优化提供数据支持。公交车细分数据有助于公交车运营公司识别高频率车辆,为车辆的维护、更新和优化提供决策支持。
(1)数据收集:从公司的设备运营平台收集宁波市不同公交车的扫码和刷卡频率数据,包括统计日期、公交车编号、近7日扫码频次(S7)、近7日刷卡频次(C7)、近30日扫码频次(S30)、近30日刷卡频次(C30)、近90日扫码频次(S90)、近90日刷卡频次(C90)等数据。(2)分别计算该车近7日、30日和90日的日均扫码和刷卡频次(DSCF):DSCF(近7日)=(S7+C7)/7;DSCF(近30日)=(S30+C30)/30;DSCF(近90日)=(S90+C90)/90;(3)构建该车的扫码和刷卡频率指数(CSFI),公式为:CSFI=DSCF(近7日)×W1+DSCF(近30日)×W2+DSCF(近90日)×W3;W1、W2、W3是权重系数,根据实际数据分布经专家研讨确定;(4)用Min-Max标准化统计方法,将CSFI标准化为0到1的范围,并输出扫码和刷卡频率指数归一化结果(NFSC);(5)根据NFSC细分:低频车辆:NFSC ≤ 0.3;中频车辆:0.3 < NFSC ≤ 0.6;高频车辆:NFSC> 0.6;(6)趋势分析:采用移动平均统计方法分析NFSC随时间变化趋势。
Most passengers on public buses in Ningbo City pay their fares via QR code scanning and card tapping. Analyzing the frequency and trend of QR code scanning and card tapping for different buses can reflect the passenger flow and its trend to a certain extent, thereby reasonably allocating vehicle and human resources, and providing data support for route optimization. Detailed bus operation data helps bus operating companies identify high-frequency buses, providing decision support for vehicle maintenance, renewal and optimization.
(1) Data Collection: Collect QR code scanning and card tapping frequency data of different buses in Ningbo from the company's equipment operation platform, including statistical date, bus number, 7-day cumulative QR code scanning frequency (S7), 7-day cumulative card tapping frequency (C7), 30-day cumulative QR code scanning frequency (S30), 30-day cumulative card tapping frequency (C30), 90-day cumulative QR code scanning frequency (S90), 90-day cumulative card tapping frequency (C90) and other relevant data.
(2) Calculate the daily average scanning and card tapping frequency (DSCF, Daily Average Scanning and Card Tapping Frequency) of the bus over the past 7, 30 and 90 days respectively:
DSCF (7-day) = (S7 + C7) / 7;
DSCF (30-day) = (S30 + C30) / 30;
DSCF (90-day) = (S90 + C90) / 90;
(3) Construct the Scanning and Card Tapping Frequency Index (CSFI) of the bus, with the formula:
CSFI = DSCF (7-day) × W1 + DSCF (30-day) × W2 + DSCF (90-day) × W3;
W1, W2, W3 are weight coefficients, which are determined through expert discussions based on the actual data distribution.
(4) Use the Min-Max normalization statistical method to scale CSFI to the range of 0 to 1, and output the normalized Scanning and Card Tapping Frequency Index (NFSC).
(5) Classify buses based on NFSC:
Low-frequency buses: NFSC ≤ 0.3;
Medium-frequency buses: 0.3 < NFSC ≤ 0.6;
High-frequency buses: NFSC > 0.6;
(6) Trend Analysis: Adopt the moving average statistical method to analyze the time-varying trend of NFSC.
提供机构:
宁波公共信息服务运营有限公司
创建时间:
2024-11-06
搜集汇总
数据集介绍
特点
该数据集包含宁波市不同公交车的扫码和刷卡频率数据,通过分析这些数据可以优化公交车运营和路线规划。数据每日更新,规模为748条,适用于公交车运营公司的决策支持。
以上内容由遇见数据集搜集并总结生成


