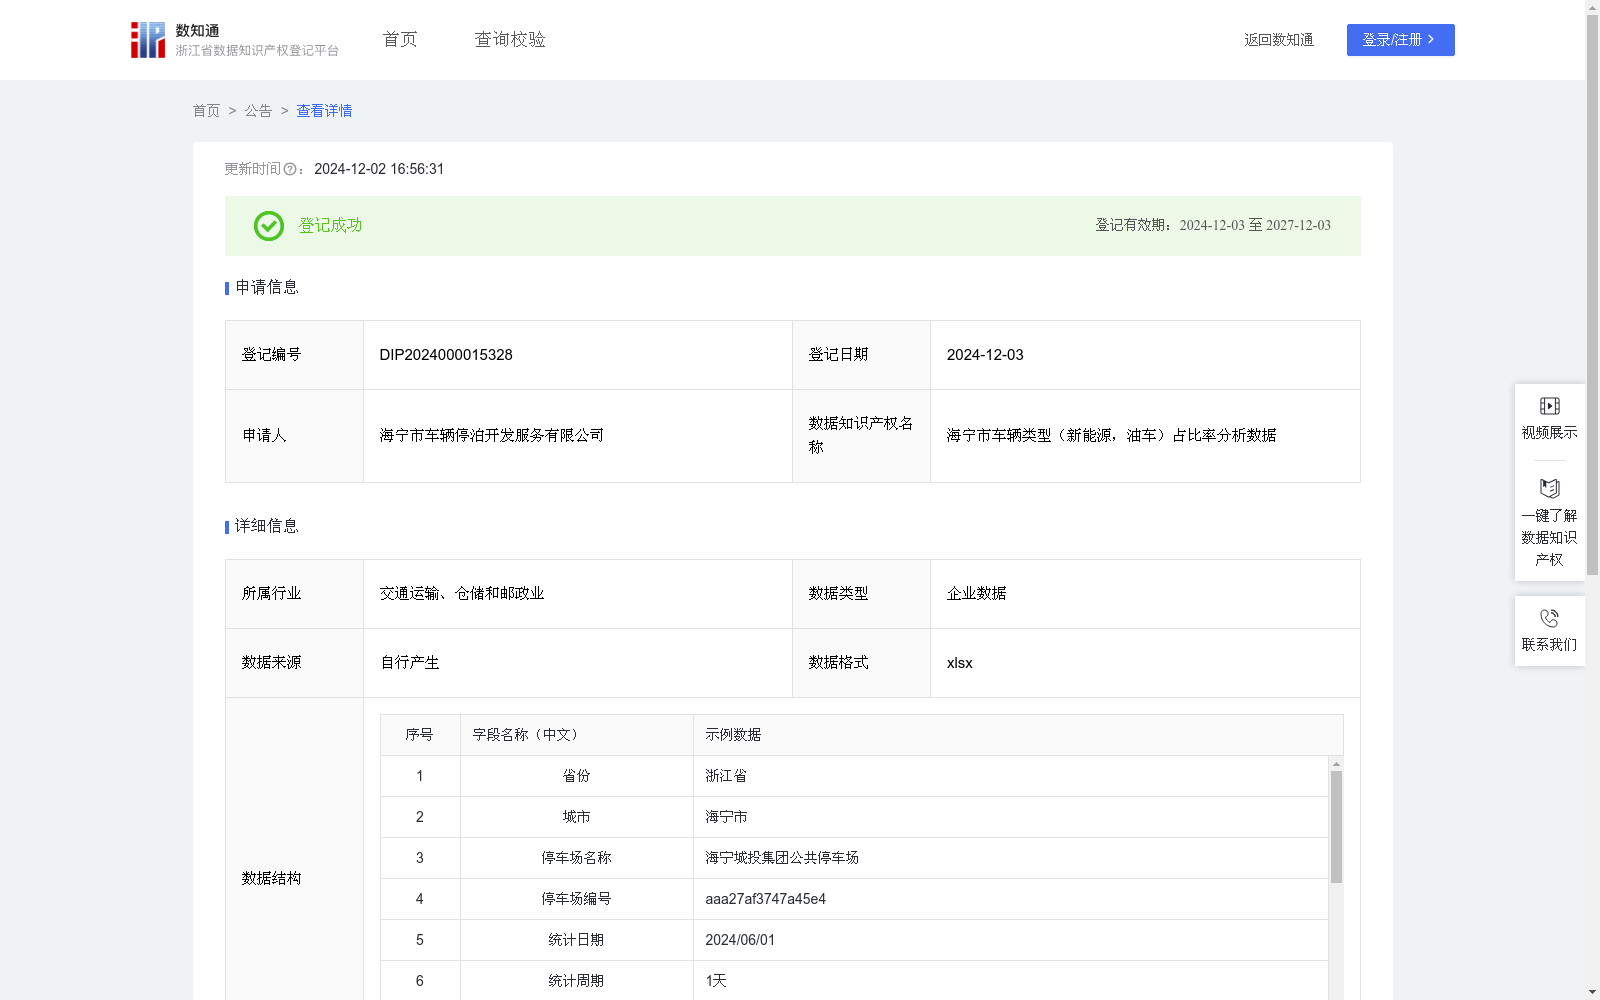
海宁市车辆类型(新能源,油车)占比率分析数据
收藏浙江省数据知识产权登记平台2024-12-02 更新2024-12-03 收录
下载链接:
https://www.zjip.org.cn/home/announce/trends/92701
下载链接
链接失效反馈官方服务:
资源简介:
通过对车辆类型数据的分析,管理部门可以了解不同类型车辆的分布情况。如果发现新能源车辆的占比逐渐增加,可以在相关区域增设更多充电桩;如果油车占比仍然较高,可以考虑维持现有加油设施的数量。这种分析可以应用于城市基础设施的规划,通过车辆类型分布优化充电桩和加油站的布局;还可以应用于环保政策制定,通过新能源车辆占比变化,评估环保政策的实施效果,优化政策措施;同时,这种分析还可以用于市场需求预测,帮助充电桩运营企业了解未来需求,合理规划投资和运营策略。这些应用场景能够帮助政府和企业更好地理解车辆类型的变化趋势,提升城市基础设施的适应性和环保政策的有效性。数据采集:从停车场管理系统中获取相关数据,包括省份、城市、停车场名称、停车场编号、电车数量、油车数量、停车总数、日期等基础数据。
数据处理:提取各停车场的停车订单总数以及停车订单电车数量和停车订单油车数量,停车位数量,充电桩数量,日期等,标识不同停车场的数据,分析不同类型车辆的分布情况,通过计算不同日期的油、电车占比率生成折线图展现变化趋势。统计每个停车场的电车数量和油车数量,计算其占停车总数的比例,对比分析电车占比与充电桩和车位比例关系。
电车占比=电车停车订单总数/停车订单总数
油车占比=油车停车订单总数/停车订单总数
充电车位比=充电桩总数/停车位总数
当电车占比大于充电车位比时,则建议增加充电设施,反之则不建议增加。当在统计周期内的油车占比率小于10%时,则建议减少优化附近的加油设施。
By analyzing vehicle type data, management authorities can grasp the distribution of different vehicle categories. If the proportion of new energy vehicles (NEVs) gradually increases, more charging piles can be deployed in relevant areas; if the proportion of gasoline-powered vehicles remains relatively high, consideration may be given to maintaining the current number of refueling facilities. This analysis can be applied to urban infrastructure planning to optimize the layout of charging piles and gas stations based on vehicle type distribution; it can also be used for environmental policy formulation, where changes in the proportion of NEVs are utilized to evaluate the implementation effects of environmental protection policies and optimize policy measures. Additionally, it can support market demand forecasting, helping charging pile operators understand future demand and reasonably plan investment and operation strategies. These application scenarios enable governments and enterprises to better comprehend the changing trends of vehicle types, enhancing the adaptability of urban infrastructure and the effectiveness of environmental protection policies.
Data Collection: Relevant data is acquired from parking lot management systems, including basic information such as province, city, parking lot name, parking lot ID, number of electric vehicles, number of gasoline-powered vehicles, total parking volume, and date.
Data Processing: Extract the total number of parking orders, the count of electric vehicle parking orders, the count of gasoline-powered vehicle parking orders, the number of parking spaces, the number of charging piles, and the date for each parking lot. Identify data from different parking lots, analyze the distribution of different vehicle types, and generate line charts to demonstrate changing trends by calculating the proportions of gasoline-powered and electric vehicles on various dates. Count the number of electric and gasoline-powered vehicles in each parking lot, calculate their respective proportions of the total parking volume, and conduct a comparative analysis of the relationship between the proportion of electric vehicles and the ratio of charging piles to parking spaces.
Electric Vehicle Proportion = Total Number of Electric Vehicle Parking Orders / Total Number of Parking Orders
Gasoline-powered Vehicle Proportion = Total Number of Gasoline-powered Vehicle Parking Orders / Total Number of Parking Orders
Charging Pile to Parking Space Ratio = Total Number of Charging Piles / Total Number of Parking Spaces
When the proportion of electric vehicles exceeds the charging pile to parking space ratio, it is recommended to add more charging facilities; otherwise, no additional charging facilities are advised. When the proportion of gasoline-powered vehicles in the statistical cycle is less than 10%, it is recommended to reduce and optimize nearby refueling facilities.
提供机构:
海宁市车辆停泊开发服务有限公司
创建时间:
2024-11-12
搜集汇总
数据集介绍
以上内容由遇见数据集搜集并总结生成


