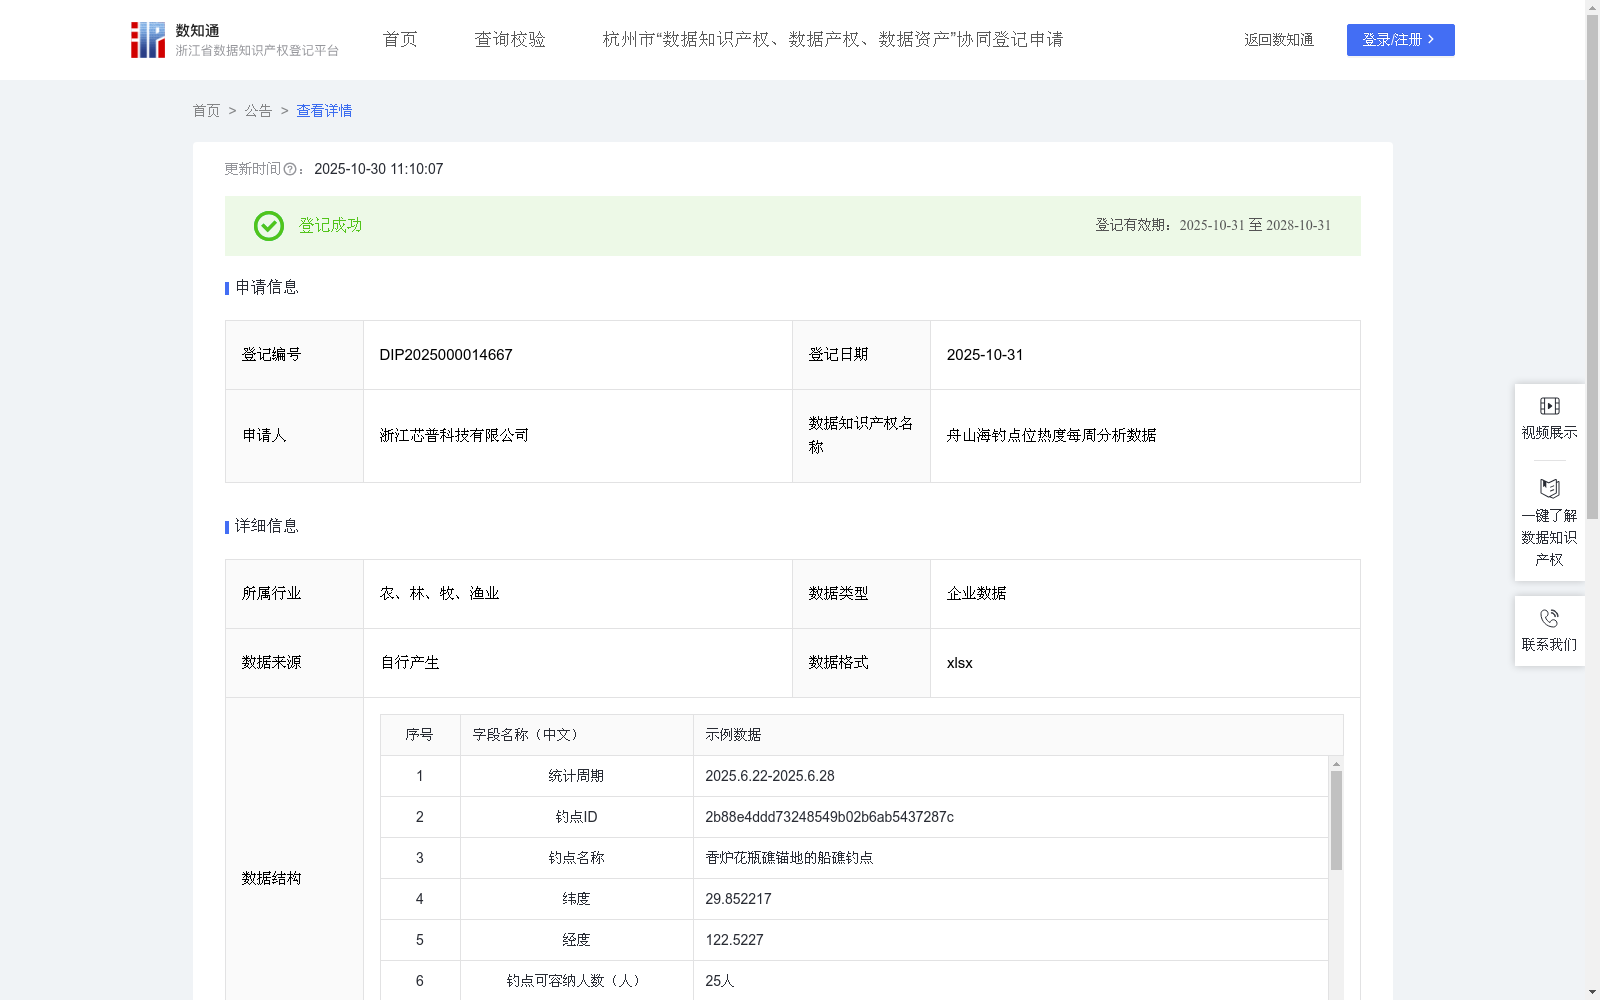
舟山海钓点位热度每周分析数据
收藏资源简介:
一、数据核心价值: 通过安全预警、资源平衡、体验优化三大闭环,实现政府-企业-用户三方协同治理。 二、具体应用场景: 1、政府海事监管 适用对象:海事局、文旅局 场景问题痛点:人工巡查难实时掌握各钓点超载风险,易引发安全事故。 解决方案:基于钓点热度等级自动预警一级高负荷钓点(钓点综合热度≥80%),定向增派巡逻艇与救援力量。 有益效果:降低钓点超载事故率,提升应急响应效率。 2、旅游平台精准推荐 适用对象:海钓预约平台 场景问题痛点:用户盲目选择冷门钓点导致体验差,热门钓点过度拥挤。 解决方案:按周排名TOP3推送高热度钓点,同步引导分流至二级或三级热度的钓点。 效果:提升用户满意度,使钓点资源利用率均衡化。 3、海钓服务公司调度优化 适用对象:海钓船舶租赁公司 场景问题痛点:海钓船舶集中停泊在高热度钓点,低热度钓点泊位闲置率高。 解决方案:结合钓点船舶占用率数据,动态调度船只至二级/三级钓点。 有益效果:提升海钓船舶周转率提升,使海钓船舶租赁公司的年营收增加。一、数据采集 数据采集来源:公司内部海钓管理系统。 (1)基础静态数据:各钓点可容纳人数(单位:人)、各钓点可容纳船舶数(单位:艘); (2)动态运营数据(按每周为一个周期进行采集):周实际钓客人数(单位:人)、周实际停泊船舶数(单位:艘); (3)辅助记录字段:出发地、周平均温度、周平均湿度、周平均气压等字段(仅用于数据记录与辅助分析,不参与核心计算)。 二、数据处理 计算关键指标: 钓客实际容量占比=周实际钓客人数/可容纳人数×100% 钓点船舶占用率=周实际船舶数/可容纳船舶数×100% 三、核心算法规则 本算法所有数据均采集自公司内部海钓管理系统。 (1)钓点综合热度分计算 公式:钓点综合热度分 = (钓客实际容量占比×0.6) + (钓点船舶占用率×0.4) 权重分配逻辑:以人员安全与服务体验(钓客实际容量占比)为核心,赋予60%权重;船舶秩序与补给效率(钓点船舶占用率)为辅,赋予40%权重。 (2)钓点热度等级分级规则 一级:钓点综合热度≥80% 二级:60%≤钓点综合热度<80% 三级:钓点综合热度<60% (3)钓点排名规则 按钓点综合热度对全部钓点进行降序排列(周期:每周7天)。 四、数据应用 (1)资源调配 依据钓点热度等级与排名,动态优化安保、补给及船舶调度资源分配。 (2)用户推荐 向钓客优先推荐高热度等级(一级)及排名靠前的钓点。
1. Core Value of the Dataset Realize collaborative governance among the government, enterprises and users through three closed-loop mechanisms: safety early warning, resource balancing and experience optimization. 2. Specific Application Scenarios 2.1 Government Maritime Supervision Target Entities: Maritime Safety Administration, Cultural and Tourism Bureau Scenario Pain Points: Manual patrols cannot monitor overloading risks at all fishing spots in real time, easily leading to safety accidents. Solution: Automatically issue early warnings for first-level high-load fishing spots (comprehensive heat score ≥ 80%) based on the heat level of fishing spots, and dispatch patrol boats and rescue forces in a targeted manner. Beneficial Effects: Reduce the accident rate of overloading at fishing spots and improve emergency response efficiency. 2.2 Precise Recommendation for Tourism Platforms Target Entities: Sea fishing reservation platforms Scenario Pain Points: Users blindly choose unpopular fishing spots, resulting in poor experience, while popular fishing spots are overcrowded. Solution: Push the top 3 high-heat fishing spots in the weekly ranking, and simultaneously guide users to divert to second or third-level heat fishing spots. Effects: Improve user satisfaction and balance the utilization rate of fishing spot resources. 2.3 Scheduling Optimization for Sea Fishing Service Companies Target Entities: Sea fishing boat rental companies Scenario Pain Points: Sea fishing boats are concentrated at high-heat fishing spots, leading to a high idle berth rate at low-heat fishing spots. Solution: Dynamically dispatch boats to second/third-level fishing spots based on the ship occupancy rate data of fishing spots. Beneficial Effects: Improve the turnover rate of sea fishing vessels and increase the annual revenue of sea fishing boat rental companies. 3. Data Collection Data Collection Sources: The company's internal sea fishing management system. (1) Basic Static Data: Maximum allowable number of anglers per fishing spot (unit: person), maximum allowable number of boats per fishing spot (unit: vessel); (2) Dynamic Operational Data (collected on a weekly cycle): Actual number of anglers per week (unit: person), actual number of berthed boats per week (unit: vessel); (3) Auxiliary Recording Fields: Fields such as departure location, weekly average temperature, weekly average humidity, weekly average air pressure, etc. (only used for data recording and auxiliary analysis, not involved in core calculations). 4. Data Processing Key Indicator Calculation: Actual Angler Capacity Occupancy Rate = (Actual Number of Weekly Anglers / Maximum Allowable Anglers per Fishing Spot) × 100% Fishing Spot Ship Occupancy Rate = (Actual Number of Weekly Berthed Boats / Maximum Allowable Boats per Fishing Spot) × 100% 5. Core Algorithm Rules All data used in this algorithm are collected from the company's internal sea fishing management system. (1) Calculation of Fishing Spot Comprehensive Heat Score Formula: Fishing Spot Comprehensive Heat Score = (Actual Angler Capacity Occupancy Rate × 0.6) + (Fishing Spot Ship Occupancy Rate × 0.4) Weight Allocation Logic: Personnel safety and service experience (Actual Angler Capacity Occupancy Rate) are taken as the core, with a 60% weight; ship order and supply efficiency (Fishing Spot Ship Occupancy Rate) are used as auxiliary factors, with a 40% weight. (2) Fishing Spot Heat Level Classification Rules Level 1: Comprehensive Heat Score ≥ 80% Level 2: 60% ≤ Comprehensive Heat Score < 80% Level 3: Comprehensive Heat Score < 60% (3) Fishing Spot Ranking Rules Rank all fishing spots in descending order based on their comprehensive heat score (cycle: 7 days per week). 6. Data Application (1) Resource Allocation Dynamically optimize the allocation of security, supply and ship scheduling resources based on the heat level and ranking of fishing spots. (2) User Recommendation Prioritize recommending fishing spots of high heat level (Level 1) and high-ranking positions to anglers.