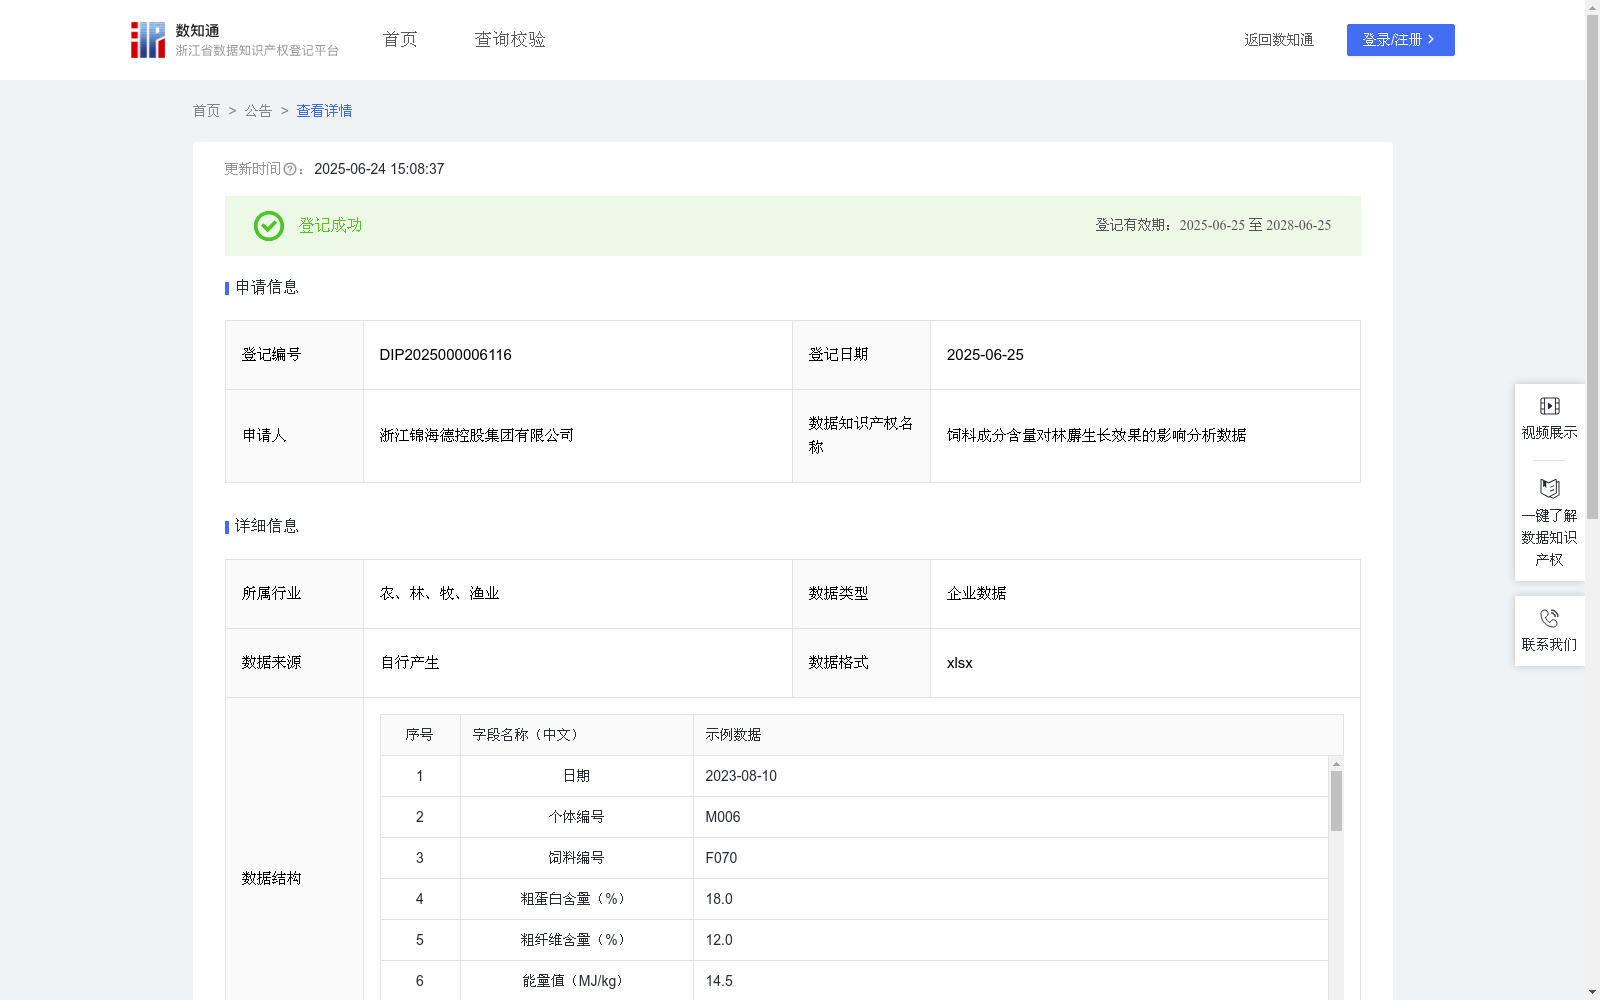
饲料成分含量对林麝生长效果的影响分析数据
收藏资源简介:
本数据集的核心价值在于通过控制变量,主要量化分析饲料粗蛋白、粗纤维和能量值等因素对于林麝生长指数的变化,为科学养殖管理提供数据支撑。具体应用场景包括: 1.养殖优化决策:基于拐点区间调整饲料粗蛋白配比,结合FGI回归模型优化蛋白-纤维-能量三元平衡,降低代谢应激风险。另外可依据标准化分数,筛选蛋白利用效率高、纤维消化能力突出的个体作为种源,提升种群抗逆性与生长稳定性。 2.政策制定支持:可为为农业部门提供粗蛋白含量阈值、纤维消化率基准等量化依据,支撑制定林麝专用饲料国家标。 3.教育推广:作为教学案例,帮助从业人员理解饲料成分含量与生长关系的动态规律,提升养殖技术培训的实践性。 4.林麝饲料生产商可以根据本数据集调整饲料成分配比,提升饲料的使用效果。1.数据采集。数据采集自申请人自有林麝养殖基地,采集:日期、个体编号、饲料编号、粗蛋白含量(%)、粗纤维含量(%)、能量值、初始体重(IW)、终末体重(FW)、总进食量(FI)、粪便纤维量、所属蛋白组(1%间隔划分)等字段。去除异常值确保数据质量。 2.生长效能计算。① 基础指标计算:1)蛋白增重效率(PEG):PEG=(FW−IW)/(FI×粗蛋白含量)×100%;2)纤维消化系数(FDC):FDC=(1-粪便纤维量/(FI×粗纤维含量))×100%;3)能量消耗率(ECR):ECR= (FI × 能量值) /(FW - IW);4)组内均值:分组聚合计算蛋白组内均值(M_PEG, M_FDC, M_ECR);5)离散度:滑动窗口标准差计算组内离散度(S_PEG, S_FDC, S_ECR)。② 综合指数计算(Z-score标准计分法):1)蛋白增重效率标准化(正向):Z_PEG=(PEG−M_PEG)/S_PEG;2)纤维消化系数标准化(正向):Z_FDC=(FDC−M_FDC)/S_FDC;3)能量消耗率标准化(逆向):Z_ECR=(M_ECR−ECR)/S_ECR;4)饲料生长指数(FGI):FGI=0.45×Z_PEG+0.3×Z_FDC+0.25×Z_ECR。 3.成分建模。① 分段回归模型:FGI=β1×(粗蛋白含量)²+β2×(粗蛋白含量)²+β3×粗蛋白含量+ϵ(R2≥0.65);②最优粗蛋白区间:通过二阶导数求拐点区间[Y1,Y2];③效能分区:适宜区:粗蛋白含量处于拐点区间±0.5%范围内;应激区:粗蛋白含量超出区间范围。
The core value of this dataset lies in quantitatively analyzing the impacts of factors including crude protein, crude fiber and energy value in feed on the growth indices of forest musk deer via controlled experiments, so as to provide data support for scientific breeding management. Specific application scenarios include: 1. Breeding Optimization Decision-making: Adjust the crude protein ratio of feed based on the inflection point interval, optimize the ternary balance of protein-fiber-energy combined with the FGI regression model, and reduce the risk of metabolic stress. Additionally, individuals with high protein utilization efficiency and outstanding fiber digestion ability can be screened as breeding stock based on standardized scores, so as to enhance the stress resistance and growth stability of the population. 2. Policy-making Support: Provide quantitative bases such as crude protein content thresholds and fiber digestibility benchmarks for agricultural authorities, to support the formulation of national standards for special feed for forest musk deer. 3. Education and Promotion: Serve as a teaching case to help practitioners understand the dynamic laws of the relationship between feed component content and growth, and improve the practicality of breeding technology training. 4. Forest musk deer feed manufacturers can adjust the feed formula according to this dataset to improve the feeding effect of the feed. 1. Data Collection. The data is collected from the applicant's own forest musk deer breeding base, covering fields such as: date, individual number, feed number, crude protein content (%), crude fiber content (%), energy value, initial weight (IW), final weight (FW), total feed intake (FI), fecal fiber amount, and affiliated protein group (divided at 1% intervals). Outliers are removed to ensure data quality. 2. Growth Efficiency Calculation. ① Basic Index Calculation: 1) Protein Gain Efficiency (PEG): PEG = (FW − IW) / (FI × crude protein content) × 100%; 2) Fiber Digestion Coefficient (FDC): FDC = (1 − fecal fiber amount / (FI × crude fiber content)) × 100%; 3) Energy Consumption Rate (ECR): ECR = (FI × energy value) / (FW − IW); 4) Within-group Mean: Calculate the within-protein-group means (M_PEG, M_FDC, M_ECR) via grouping aggregation; 5) Dispersion: Calculate the within-group dispersion (S_PEG, S_FDC, S_ECR) using sliding window standard deviation. ② Comprehensive Index Calculation (Z-score Standard Scoring Method): 1) Standardization of Protein Gain Efficiency (positive indicator): Z_PEG = (PEG − M_PEG) / S_PEG; 2) Standardization of Fiber Digestion Coefficient (positive indicator): Z_FDC = (FDC − M_FDC) / S_FDC; 3) Standardization of Energy Consumption Rate (reverse indicator): Z_ECR = (M_ECR − ECR) / S_ECR; 4) Feed Growth Index (FGI): FGI = 0.45×Z_PEG + 0.3×Z_FDC + 0.25×Z_ECR. 3. Component Modeling. ① Piecewise Regression Model: FGI = β₁×(crude protein content)² + β₂×(crude protein content)² + β₃×crude protein content + ε (R²≥0.65); ② Optimal Crude Protein Interval: Derive the inflection point interval [Y1, Y2] via the second-order derivative; ③ Efficiency Zoning: Suitable zone: crude protein content within ±0.5% of the inflection point interval; Stress zone: crude protein content exceeding the interval range.