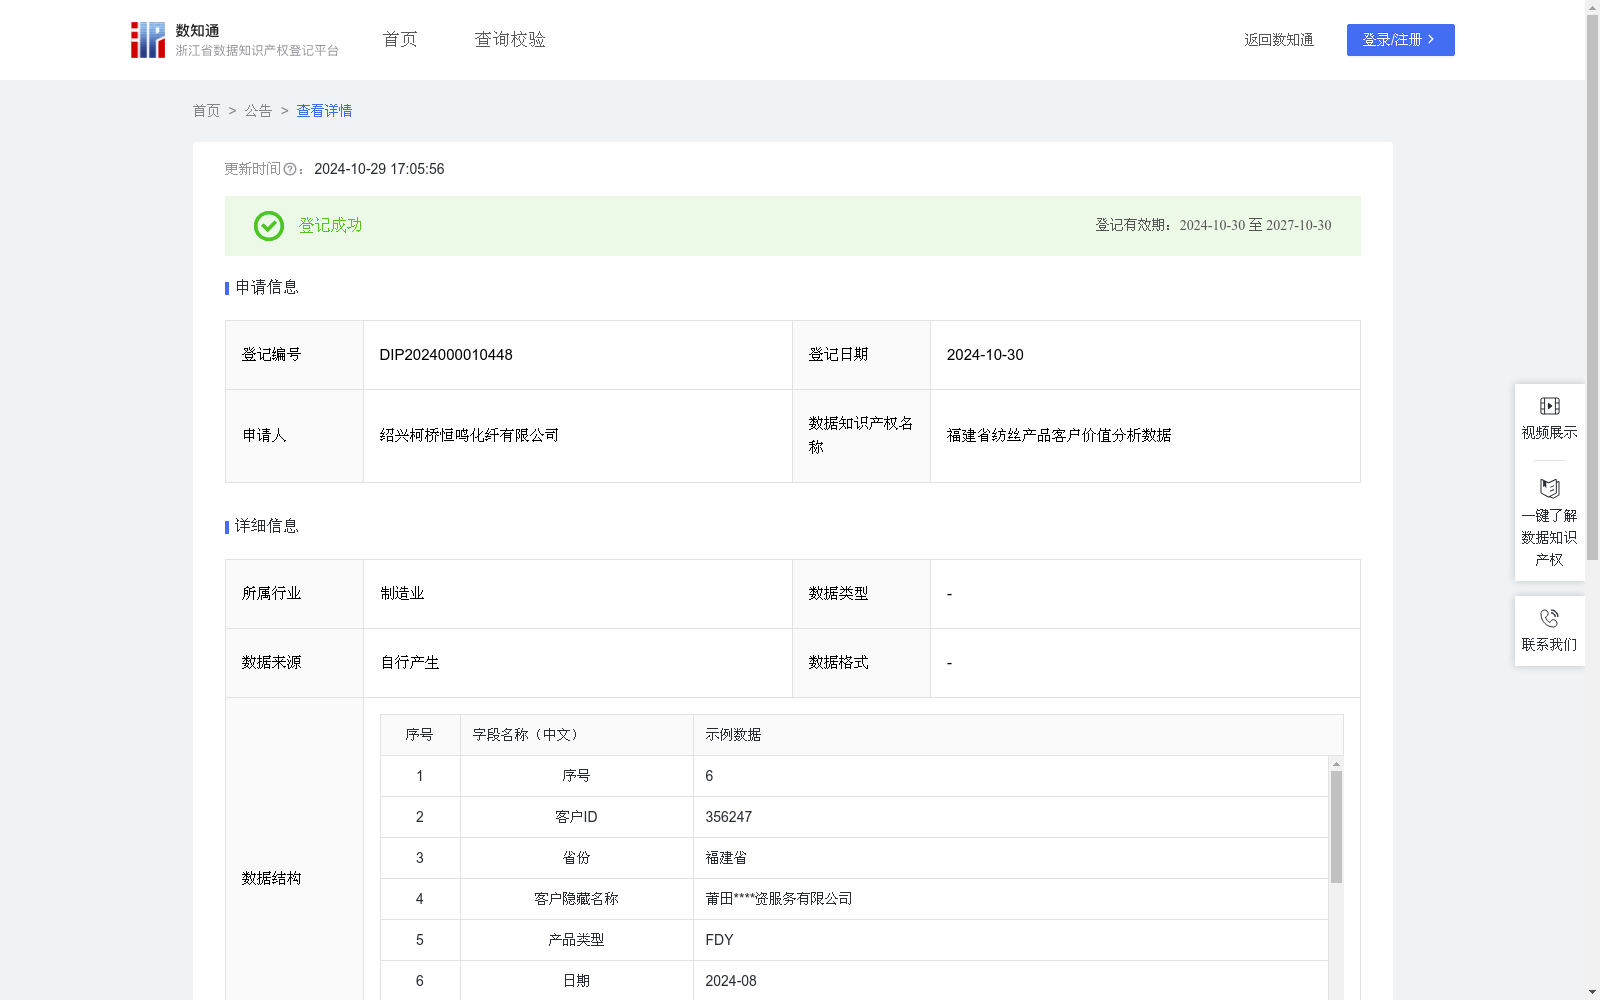
福建省纺丝产品客户价值分析数据
收藏资源简介:
纺丝行业市场竞争激烈具有产品种类繁多、客户需求多样等。 通过对福建省纺丝产品的客户进行产品类型、时间间隔、购买次数、金额等进行深入分析并建立 RFM模型, 通过应用RFM模型,并对客户进行价值分类。 根据客户价值分类,纺丝企业更加深入地了解客户需求和市场变化,制定更加科学合理的营销策略和服务方案, 从而在激烈的市场竞争中保持竞争优势。 1.数据采集:自有采集公司的销售数据,如客户的订单信息、支付信息、购买时间、购买数量、购买金额等关键数据。 2.数据处理:根据RFM模型的指标需求,分别计算对客户的最近一次消费时间距离当前天数R,分类汇总消费频次F以及消费总金额M,对数据进行汇总分类求和等清理工作; 3.数据计算:R指标=(月天数-R)/月天数*10;M指标=M/最高消费总金额*10,最高消费总金额为采集时间段内客户下单总额的最高值;F指标=F/最高消费频次*10,最高消费频次为采集时间段内客户消费频次的最高值;RFM综合评分X=w1*R指标+w2*F指标+w3*M指标,w1,w2,w3为权重系数分别为3,3,4。再根据RFM综合评分对客户进行分类,RFM综合评分X≥26,为高等级客户,RFM综合评分在(4,26)之间的,分为中等级客户,其余为低等级。 4.数据应用:根据RFM模型的计算结果和其他指标,将客户划分为不同的群体,为不同客户群体制定针对性的营销策略和服务方案。
The textile spinning industry faces fierce market competition, characterized by a wide range of product categories and diverse customer demands. An in-depth analysis was conducted on customers of textile spinning products in Fujian Province, covering product types, purchase time intervals, purchase frequencies, and purchase amounts, based on which an RFM model was established. The RFM model was then applied to classify customers by their value. By classifying customers based on their value, spinning enterprises can gain a deeper understanding of customer needs and market changes, formulate more scientific and reasonable marketing strategies and service plans, and thus maintain a competitive edge in the fierce market competition. 1. Data Collection: Sales data from the in-house data collection company was used, including key information such as customer order details, payment records, purchase time, purchase quantity, and purchase amount. 2. Data Processing: According to the indicator requirements of the RFM model, the number of days since the customer's last purchase (denoted as R), the purchase frequency F, and the total purchase amount M were calculated separately. Data cleaning operations including aggregation, classification, and summation were carried out on the collected data. 3. Data Calculation: The R indicator was calculated as (Days in a month - R) / Days in a month * 10; the M indicator was calculated as M / Maximum Total Purchase Amount * 10, where the Maximum Total Purchase Amount refers to the highest total order amount of all customers during the data collection period; the F indicator was calculated as F / Maximum Purchase Frequency * 10, where the Maximum Purchase Frequency refers to the highest purchase frequency of all customers during the data collection period. The comprehensive RFM score X was calculated as X = w1*R + w2*F + w3*M, where the weight coefficients w1, w2, w3 are 3, 3, and 4 respectively. Customers were classified based on their comprehensive RFM score X: high-value customers for X ≥ 26, medium-value customers for 4 < X < 26, and low-value customers for the remaining cases. 4. Data Application: Based on the calculation results of the RFM model and other indicators, customers were divided into different groups, and targeted marketing strategies and service plans were formulated for each customer group.