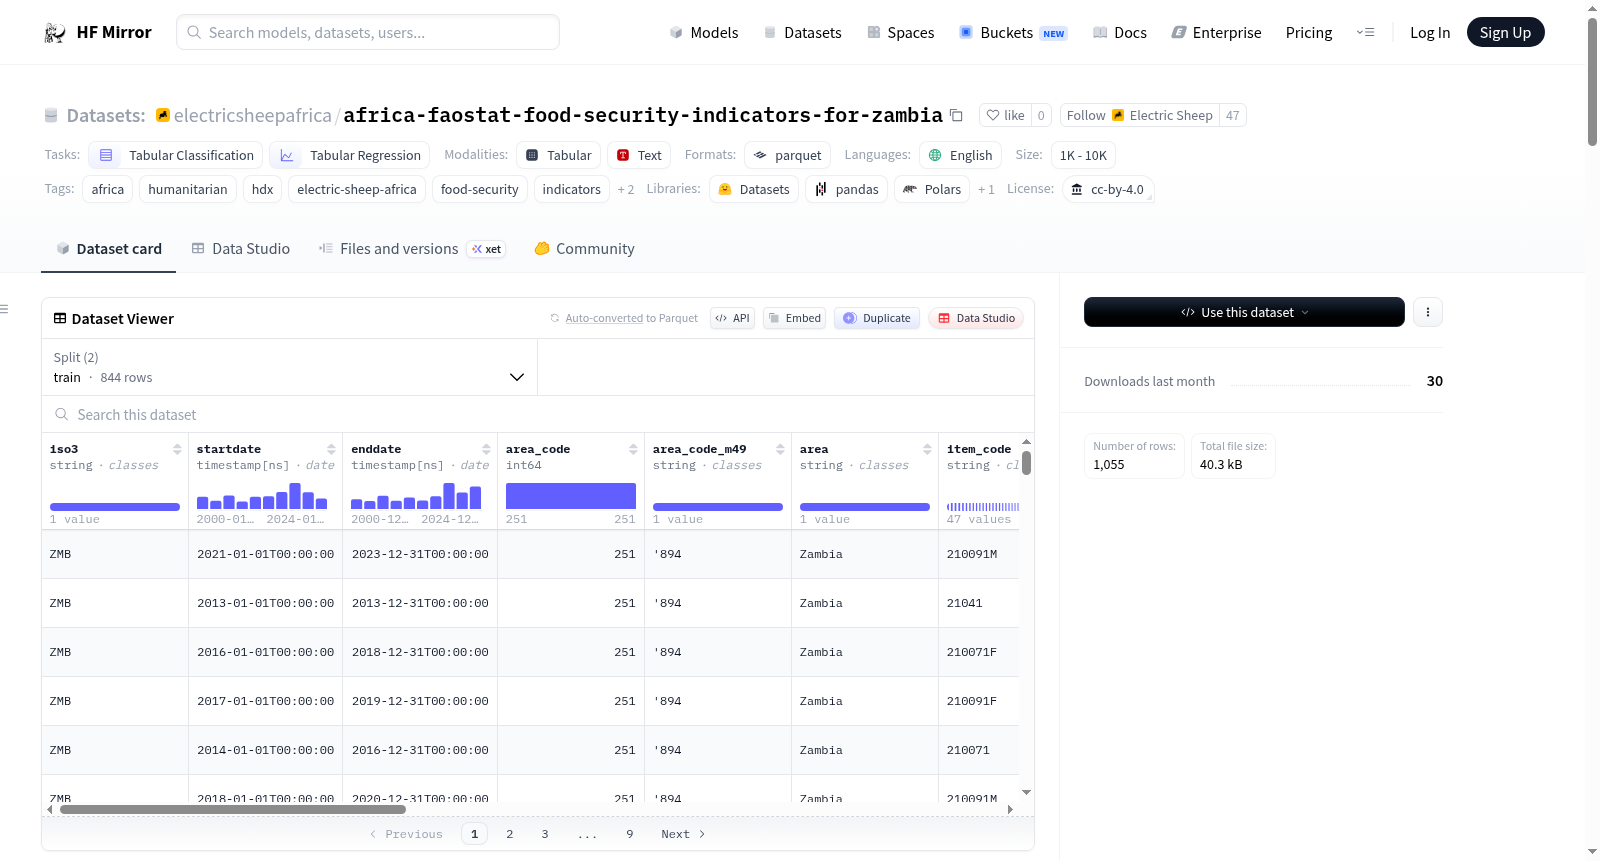
electricsheepafrica/africa-faostat-food-security-indicators-for-zambia
收藏Hugging Face2026-04-11 更新2026-04-12 收录
下载链接:
https://hf-mirror.com/datasets/electricsheepafrica/africa-faostat-food-security-indicators-for-zambia
下载链接
链接失效反馈官方服务:
资源简介:
---
annotations_creators:
- no-annotation
language_creators:
- found
language:
- en
license: cc-by-4.0
multilinguality:
- monolingual
size_categories:
- 1K<n<10K
source_datasets:
- original
task_categories:
- tabular-classification
- tabular-regression
task_ids: []
tags:
- africa
- humanitarian
- hdx
- electric-sheep-africa
- food-security
- indicators
- nutrition
- zmb
pretty_name: "Zambia - Food Security and Nutrition Indicators"
dataset_info:
splits:
- name: train
num_examples: 844
- name: test
num_examples: 211
---
# Zambia - Food Security and Nutrition Indicators
**Publisher:** Food and Agriculture Organization (FAO) of the United Nations · **Source:** [HDX](https://data.humdata.org/dataset/faostat-food-security-indicators-for-zambia) · **License:** `cc-by-igo` · **Updated:** 2026-04-06
---
## Abstract
Food Security and Nutrition Indicators for Zambia.
Contains data from the FAOSTAT [bulk data service](https://fenixservices.fao.org/faostat/static/bulkdownloads/datasets_E.json).
Each row in this dataset represents country-level aggregates. Temporal coverage is indicated by the `startdate`, `enddate` column(s). Geographic scope: **ZMB**.
*Curated into ML-ready Parquet format by [Electric Sheep Africa](https://huggingface.co/electricsheepafrica).*
---
## Dataset Characteristics
| | |
|---|---|
| **Domain** | Food security and nutrition |
| **Unit of observation** | Country-level aggregates |
| **Rows (total)** | 1,055 |
| **Columns** | 18 (5 numeric, 11 categorical, 2 datetime) |
| **Train split** | 844 rows |
| **Test split** | 211 rows |
| **Geographic scope** | ZMB |
| **Publisher** | Food and Agriculture Organization (FAO) of the United Nations |
| **HDX last updated** | 2026-04-06 |
---
## Variables
**Geographic** — `iso3` (ZMB), `year_code` (range 2000.0–20222024.0), `year` (range 2000.0–2024.0).
**Temporal** — `startdate`, `enddate`.
**Outcome / Measurement** — `value` (range -23.0–3716.0).
**Identifier / Metadata** — `area_code` (range 251.0–251.0), `area_code_m49` ('894), `item_code` (210071, 210091F, 210081F), `element_code` (range 6121.0–61322.0), `esa_source` (HDX) and 1 others.
**Other** — `area` (Zambia), `item` (Number of severely food insecure people (million) (3-year average), Prevalence of moderate or severe food insecurity in the female adult population (percent) (3-year average), Number of moderately or severely food insecure female adults (million) (3-year average)), `element` (Value, Confidence interval: Lower bound, Confidence interval: Upper bound), `unit` (%, million No, kcal/cap/d), `flag` (E, X, A) and 1 others.
---
## Quick Start
```python
from datasets import load_dataset
ds = load_dataset("electricsheepafrica/africa-faostat-food-security-indicators-for-zambia")
train = ds["train"].to_pandas()
test = ds["test"].to_pandas()
print(train.shape)
train.head()
```
---
## Schema
| Column | Type | Null % | Range / Sample Values |
|---|---|---|---|
| `iso3` | object | 0.0% | ZMB |
| `startdate` | datetime64[ns] | 0.0% | |
| `enddate` | datetime64[ns] | 0.0% | |
| `area_code` | int64 | 0.0% | 251.0 – 251.0 (mean 251.0) |
| `area_code_m49` | object | 0.0% | '894 |
| `area` | object | 0.0% | Zambia |
| `item_code` | object | 0.0% | 210071, 210091F, 210081F |
| `item` | object | 0.0% | Number of severely food insecure people (million) (3-year average), Prevalence of moderate or severe food insecurity in the female adult population (percent) (3-year average), Number of moderately or severely food insecure female adults (million) (3-year average) |
| `element_code` | int64 | 0.0% | 6121.0 – 61322.0 (mean 17415.781) |
| `element` | object | 0.0% | Value, Confidence interval: Lower bound, Confidence interval: Upper bound |
| `year_code` | int64 | 0.0% | 2000.0 – 20222024.0 (mean 10811275.0436) |
| `year` | int64 | 0.0% | 2000.0 – 2024.0 (mean 2014.3801) |
| `unit` | object | 2.1% | %, million No, kcal/cap/d |
| `value` | float64 | 0.0% | -23.0 – 3716.0 (mean 271.2157) |
| `flag` | object | 0.0% | E, X, A |
| `note` | object | 69.3% | Official estimate integrated with FAO data, Official estimate |
| `esa_source` | object | 0.0% | HDX |
| `esa_processed` | object | 0.0% | |
---
## Numeric Summary
| Column | Min | Max | Mean | Median |
|---|---|---|---|---|
| `area_code` | 251.0 | 251.0 | 251.0 | 251.0 |
| `element_code` | 6121.0 | 61322.0 | 17415.781 | 6128.0 |
| `year_code` | 2000.0 | 20222024.0 | 10811275.0436 | 20032005.0 |
| `year` | 2000.0 | 2024.0 | 2014.3801 | 2016.0 |
| `value` | -23.0 | 3716.0 | 271.2157 | 12.8 |
---
## Curation
Raw data was downloaded from HDX via the CKAN API and converted to Parquet. Column names were lowercased and standardised to snake_case. Common missing-value markers (`N/A`, `null`, `none`, `-`, `unknown`, `no data`, `#N/A`) were unified to `NaN`. 2 column(s) were cast from string to numeric or datetime based on parse-success rate (>85% threshold). The dataset was split 80/20 into train and test partitions using a fixed random seed (42) and saved as Snappy-compressed Parquet.
---
## Limitations
- Data originates from Food and Agriculture Organization (FAO) of the United Nations and has not been independently validated by ESA.
- Automated cleaning cannot correct for misreported values, definitional inconsistencies, or sampling bias in the original collection.
- The following columns have >20% missing values and should be treated with caution in modelling: `note`.
- Refer to the [original HDX dataset page](https://data.humdata.org/dataset/faostat-food-security-indicators-for-zambia) for the publisher's own methodology notes and caveats.
---
## Citation
```bibtex
@dataset{hdx_africa_faostat_food_security_indicators_for_zambia,
title = {Zambia - Food Security and Nutrition Indicators},
author = {Food and Agriculture Organization (FAO) of the United Nations},
year = {2026},
url = {https://data.humdata.org/dataset/faostat-food-security-indicators-for-zambia},
note = {Repackaged for machine learning by Electric Sheep Africa (https://huggingface.co/electricsheepafrica)}
}
```
---
*[Electric Sheep Africa](https://huggingface.co/electricsheepafrica) — Africa's ML dataset infrastructure. Lagos, Nigeria.*
提供机构:
electricsheepafrica
搜集汇总
数据集介绍
构建方式
在粮食安全监测领域,数据质量直接影响政策制定的科学性。该数据集源自联合国粮农组织(FAO)的FAOSTAT批量数据服务,通过人道主义数据交换平台(HDX)获取原始资料。Electric Sheep Africa团队运用自动化流程进行数据清洗与标准化,将列名统一为蛇形命名法,并将常见的缺失值标记规范为NaN。依据解析成功率超过85%的阈值,将两列数据从字符串类型转换为数值或日期时间类型。最终,采用固定随机种子(42)将数据集按80/20的比例划分为训练集与测试集,并以Snappy压缩的Parquet格式保存,确保了数据的机器学习就绪性。
使用方法
为便于机器学习任务的应用,该数据集已预分为训练集(844行)与测试集(211行)。使用者可通过Hugging Face的`datasets`库直接加载,并利用`to_pandas()`方法转换为Pandas DataFrame进行后续分析。该数据集适用于表格分类与回归任务,能够支持粮食安全趋势预测、脆弱性评估等研究。在建模前,建议参考原始HDX页面了解粮农组织的详细方法论与注意事项,并对高缺失率字段进行适当处理,以确保分析结果的稳健性。
背景与挑战
背景概述
在粮食安全与营养监测领域,系统化、可计算的数据集对于政策制定与学术研究至关重要。'Zambia - Food Security and Nutrition Indicators'数据集由联合国粮食及农业组织(FAO)发布,并由Electric Sheep Africa于2026年重新整理为机器学习可用格式。该数据集聚焦赞比亚国家层面的粮食安全与营养指标,涵盖2000年至2024年的时序数据,核心研究问题在于量化并追踪该国在消除饥饿、改善营养状况方面的进展。作为非洲区域粮食安全监测的重要数据源,该数据集为发展经济学、公共卫生及农业政策研究提供了实证基础,有助于揭示长期趋势并评估干预措施的有效性。
当前挑战
该数据集旨在解决粮食安全与营养状况的量化评估挑战,具体涉及多维度指标的整合与时序分析。领域问题的挑战包括指标定义的复杂性,例如'严重粮食不安全人口'与'中度或严重粮食不安全流行率'等变量需基于统一标准进行跨国可比性校准;同时,数据中置信区间的存在要求模型能够处理不确定性估计。在构建过程中,挑战主要源于原始数据的异构性,如数值范围跨度大(-23至3716)、部分字段缺失值率高(如'note'字段缺失率达69.3%),以及分类变量编码不一致。此外,自动化清洗流程难以修正原始数据收集可能存在的报告偏差或定义不一致问题,这要求使用者谨慎处理数据质量限制。
常用场景
经典使用场景
在粮食安全与营养监测领域,该数据集为赞比亚的国家级宏观分析提供了结构化数据支撑。研究者通常利用其时间序列特征,对严重粮食不安全人口数量、女性成年人口中中度或严重粮食不安全流行率等关键指标进行建模与预测。通过整合数值型变量与分类元数据,该数据集支持回归与分类任务,例如基于历史数据预测未来粮食不安全趋势,或识别不同人口群体间的风险差异,从而为政策制定提供量化依据。
解决学术问题
该数据集有效应对了粮食安全研究中数据稀缺与标准化不足的挑战。它系统整合了联合国粮农组织的权威统计,使得学者能够深入探究粮食不安全的时空演变规律、性别差异及其社会经济驱动因素。通过提供置信区间等元数据,该数据集助力于不确定性量化分析,提升了研究结论的稳健性。其存在促进了跨学科融合,将计量经济学、公共卫生与数据科学方法引入粮食安全评估,推动了该领域从定性描述向精准量化研究的范式转变。
实际应用
在实际应用层面,该数据集为赞比亚及国际发展机构提供了决策支持工具。政府部门可依据其揭示的趋势,精准定位粮食援助与营养干预的目标区域与人群,优化资源配置。非政府组织利用这些指标监测项目成效,评估扶贫与农业支持政策的影响。此外,该数据集可作为早期预警系统的数据源,帮助预测粮食危机风险,从而提前启动人道主义响应,增强社区抵御冲击的能力,最终服务于联合国可持续发展目标中消除饥饿与改善营养的具体实践。
数据集最近研究
最新研究方向
在粮食安全与营养监测领域,赞比亚的FAO统计数据为机器学习模型提供了关键时序特征。当前研究聚焦于利用该数据集构建多变量预测框架,旨在分析女性人口中重度粮食不安全发生率等指标与气候波动、经济政策的动态关联。学者们正探索集成Transformer架构的回归模型,以捕捉2000年至2024年间粮食安全趋势的长期依赖关系,同时结合置信区间数据量化预测不确定性。这类研究不仅助力联合国可持续发展目标(SDG)的监测评估,更为撒哈拉以南非洲地区的精准干预政策提供了数据驱动的决策支持。
以上内容由遇见数据集搜集并总结生成


