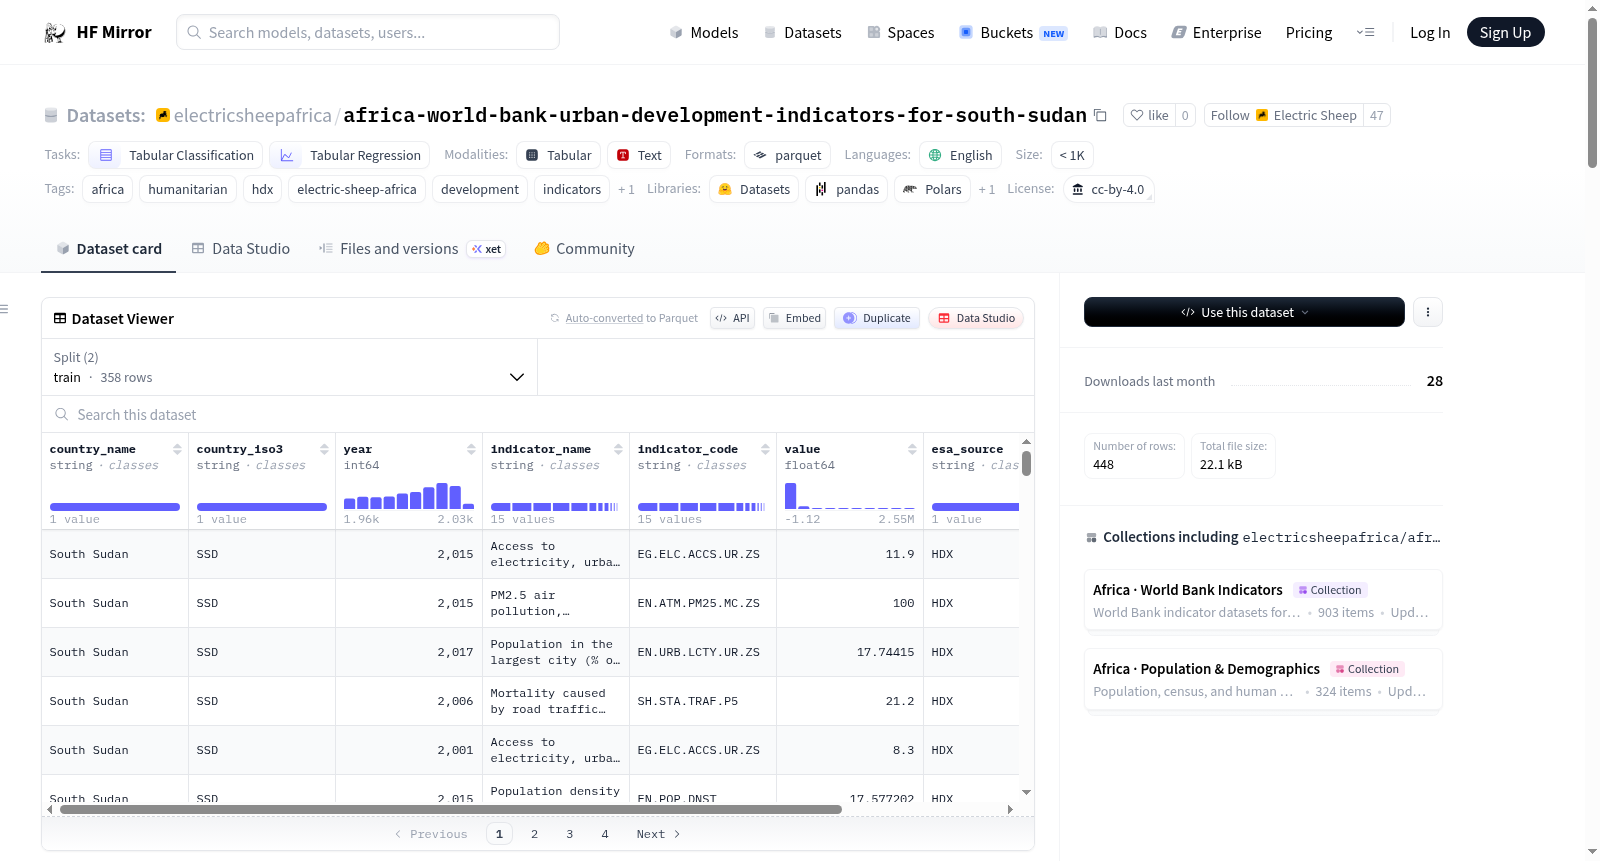
electricsheepafrica/africa-world-bank-urban-development-indicators-for-south-sudan
收藏Hugging Face2026-04-10 更新2026-04-12 收录
下载链接:
https://hf-mirror.com/datasets/electricsheepafrica/africa-world-bank-urban-development-indicators-for-south-sudan
下载链接
链接失效反馈官方服务:
资源简介:
---
annotations_creators:
- no-annotation
language_creators:
- found
language:
- en
license: cc-by-4.0
multilinguality:
- monolingual
size_categories:
- n<1K
source_datasets:
- original
task_categories:
- tabular-classification
- tabular-regression
task_ids: []
tags:
- africa
- humanitarian
- hdx
- electric-sheep-africa
- development
- indicators
- ssd
pretty_name: "South Sudan - Urban Development"
dataset_info:
splits:
- name: train
num_examples: 358
- name: test
num_examples: 89
---
# South Sudan - Urban Development
**Publisher:** World Bank Group · **Source:** [HDX](https://data.humdata.org/dataset/world-bank-urban-development-indicators-for-south-sudan) · **License:** `cc-by` · **Updated:** 2026-03-27
---
## Abstract
Contains data from the World Bank's [data portal](http://data.worldbank.org/). There is also a [consolidated country dataset](https://data.humdata.org/dataset/world-bank-combined-indicators-for-south-sudan) on HDX.
Cities can be tremendously efficient. It is easier to provide water and sanitation to people living closer together, while access to health, education, and other social and cultural services is also much more readily available. However, as cities grow, the cost of meeting basic needs increases, as does the strain on the environment and natural resources. Data on urbanization, traffic and congestion, and air pollution are from the United Nations Population Division, World Health Organization, International Road Federation, World Resources Institute, and other sources.
Each row in this dataset represents country-level aggregates. Data was last updated on HDX on 2026-03-27. Geographic scope: **SSD**.
*Curated into ML-ready Parquet format by [Electric Sheep Africa](https://huggingface.co/electricsheepafrica).*
---
## Dataset Characteristics
| | |
|---|---|
| **Domain** | Public health |
| **Unit of observation** | Country-level aggregates |
| **Rows (total)** | 448 |
| **Columns** | 8 (2 numeric, 6 categorical, 0 datetime) |
| **Train split** | 358 rows |
| **Test split** | 89 rows |
| **Geographic scope** | SSD |
| **Publisher** | World Bank Group |
| **HDX last updated** | 2026-03-27 |
---
## Variables
**Geographic** — `country_name` (South Sudan), `country_iso3` (SSD), `year` (range 1960.0–2025.0).
**Outcome / Measurement** — `value` (range -3.9999–2553121.0).
**Identifier / Metadata** — `indicator_name` (Population in largest city, Population in the largest city (% of urban population), Urban population), `indicator_code` (EN.URB.LCTY, EN.URB.LCTY.UR.ZS, SP.URB.TOTL), `esa_source` (HDX), `esa_processed` (2026-04-10).
---
## Quick Start
```python
from datasets import load_dataset
ds = load_dataset("electricsheepafrica/africa-world-bank-urban-development-indicators-for-south-sudan")
train = ds["train"].to_pandas()
test = ds["test"].to_pandas()
print(train.shape)
train.head()
```
---
## Schema
| Column | Type | Null % | Range / Sample Values |
|---|---|---|---|
| `country_name` | object | 0.0% | South Sudan |
| `country_iso3` | object | 0.0% | SSD |
| `year` | int64 | 0.0% | 1960.0 – 2025.0 (mean 1996.8103) |
| `indicator_name` | object | 0.0% | Population in largest city, Population in the largest city (% of urban population), Urban population |
| `indicator_code` | object | 0.0% | EN.URB.LCTY, EN.URB.LCTY.UR.ZS, SP.URB.TOTL |
| `value` | float64 | 0.0% | -3.9999 – 2553121.0 (mean 162745.4894) |
| `esa_source` | object | 0.0% | HDX |
| `esa_processed` | object | 0.0% | 2026-04-10 |
---
## Numeric Summary
| Column | Min | Max | Mean | Median |
|---|---|---|---|---|
| `year` | 1960.0 | 2025.0 | 1996.8103 | 2000.0 |
| `value` | -3.9999 | 2553121.0 | 162745.4894 | 19.4073 |
---
## Curation
Raw data was downloaded from HDX via the CKAN API and converted to Parquet. Column names were lowercased and standardised to snake_case. Common missing-value markers (`N/A`, `null`, `none`, `-`, `unknown`, `no data`, `#N/A`) were unified to `NaN`. The dataset was split 80/20 into train and test partitions using a fixed random seed (42) and saved as Snappy-compressed Parquet.
---
## Limitations
- Data originates from World Bank Group and has not been independently validated by ESA.
- Automated cleaning cannot correct for misreported values, definitional inconsistencies, or sampling bias in the original collection.
- Refer to the [original HDX dataset page](https://data.humdata.org/dataset/world-bank-urban-development-indicators-for-south-sudan) for the publisher's own methodology notes and caveats.
---
## Citation
```bibtex
@dataset{hdx_africa_world_bank_urban_development_indicators_for_south_sudan,
title = {South Sudan - Urban Development},
author = {World Bank Group},
year = {2026},
url = {https://data.humdata.org/dataset/world-bank-urban-development-indicators-for-south-sudan},
note = {Repackaged for machine learning by Electric Sheep Africa (https://huggingface.co/electricsheepafrica)}
}
```
---
*[Electric Sheep Africa](https://huggingface.co/electricsheepafrica) — Africa's ML dataset infrastructure. Lagos, Nigeria.*
提供机构:
electricsheepafrica
搜集汇总
数据集介绍
构建方式
在城市化进程日益加速的背景下,理解城市发展的多维指标对于政策制定与学术研究至关重要。本数据集由世界银行集团发布,原始数据源自其公开数据门户,并由人道主义数据交换平台(HDX)提供访问。Electric Sheep Africa团队通过CKAN API获取原始数据,进行了系统的数据清洗与标准化处理,包括统一缺失值标记、规范列名格式,并采用固定随机种子将数据按80/20比例划分为训练集与测试集,最终以Snappy压缩的Parquet格式存储,确保了数据的机器学习可用性。
特点
作为聚焦南苏丹城市发展的专题数据集,其核心特征体现在结构化与时效性上。数据集共包含448条国家层面聚合记录,涵盖1960年至2025年的时序数据,涉及最大城市人口、最大城市人口占城市人口比例及城市总人口三项关键指标。数据以表格形式呈现,包含8个字段,其中数值型与分类型变量分布清晰,且无缺失值,保证了分析的完整性。地理范围严格限定于南苏丹(SSD),数据更新至2026年,为研究该区域城市化动态提供了高精度、跨年度的观测基础。
使用方法
在机器学习与数据分析领域,本数据集适用于回归与分类任务,尤其适合探索城市化指标与经济社会发展间的关联。用户可通过Hugging Face的datasets库直接加载数据,快速转换为Pandas DataFrame以进行后续处理。数据集已预分割为训练集(358行)与测试集(89行),支持开箱即用的模型训练与评估。研究者可基于年份、指标代码等特征构建预测模型,或结合地理与时间维度开展趋势分析,但需注意数据源自世界银行,使用时应参考其原始方法论说明以理解潜在局限。
背景与挑战
背景概述
世界银行集团于2026年发布的南苏丹城市发展指标数据集,聚焦于该国的城市化进程与公共健康领域。该数据集由Electric Sheep Africa机构进行机器学习格式的整理与发布,旨在提供国家层面的聚合数据,涵盖1960年至2025年间的人口统计指标,如最大城市人口、城市人口比例等核心变量。作为非洲地区发展研究的重要资源,该数据集为理解南苏丹在快速城市化背景下的社会经济发展轨迹提供了量化基础,尤其对公共政策制定与学术研究具有显著参考价值。
当前挑战
该数据集致力于解决城市发展指标在机器学习任务中的结构化应用挑战,涉及表格分类与回归问题,例如基于历史数据预测城市化趋势或进行区域发展状态分类。在构建过程中,数据集面临原始数据质量不一、指标定义可能存在不一致性以及采样偏差等固有局限。此外,自动化清洗流程难以纠正原始收集中的误报数值,且数据依赖世界银行集团的发布,未经独立验证,这些因素均对模型的可靠性与泛化能力构成潜在制约。
常用场景
经典使用场景
在城市化与公共政策研究领域,该数据集常被用于分析南苏丹的城市人口动态及其演变规律。研究者通过整合历年城市人口、最大城市人口及其占比等指标,构建时间序列模型,以揭示该国城市化进程中的结构性特征。这类分析不仅能够量化城市扩张的速度与规模,还能为理解发展中国家城市系统的独特性提供实证基础,进而支持区域发展规划的学术探讨。
解决学术问题
该数据集有效解决了发展经济学与城市地理学中关于资源匮乏地区城市化轨迹的量化难题。通过提供标准化的国家层面聚合数据,它使学者能够系统评估南苏丹城市人口集中度、城乡结构变迁及其与基本服务可及性的关联。这些指标帮助识别城市化过程中的瓶颈与机遇,为探讨可持续发展目标下的城市韧性、基础设施压力及环境承载力等关键议题提供了可靠的数据支撑。
衍生相关工作
围绕该数据集衍生的经典工作主要包括基于机器学习的城市增长预测模型与发展指标关联分析。研究者利用其时间序列特征,训练回归模型以预估未来城市人口趋势,并结合其他社会经济数据集探索城市化与贫困率、教育水平等因素的相关性。此外,部分研究将其纳入跨非洲国家的比较框架,以检验不同区域城市化模式的异同,推动了全球南方城市理论的实证深化。
以上内容由遇见数据集搜集并总结生成


