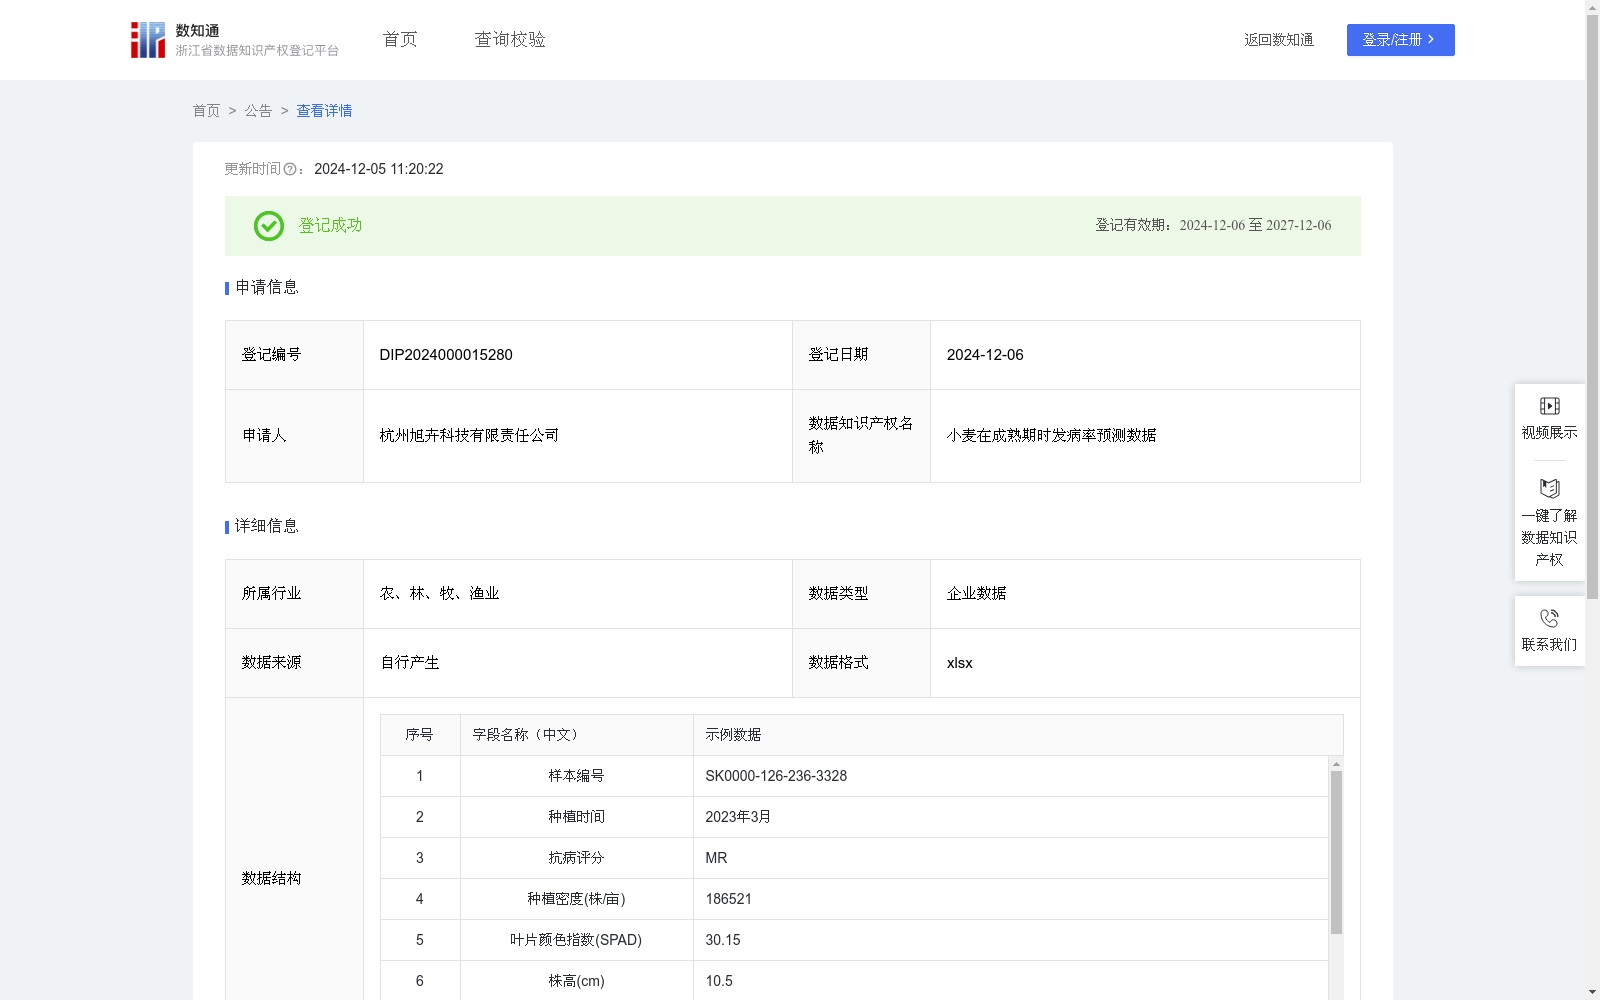
小麦在成熟期时发病率预测数据
收藏浙江省数据知识产权登记平台2024-12-05 更新2024-12-06 收录
下载链接:
https://www.zjip.org.cn/home/announce/trends/96686
下载链接
链接失效反馈官方服务:
资源简介:
通过调查采集小麦数据,并使用传统算法和多元线性回归算法预测小麦发病率。该模型的输入为抗病评分、种植密度、叶片颜色指数(SPAD)、株高(cm)、病虫害类型、生育期(天)、分蘖数。多元线性回归算法通过分析这些输入变量与小麦发病率之间的线性关系,确定每个变量的权重系数。在模型训练过程中,算法会利用小麦发病率实际值进行优化,调整权重系数以最小化预测误差。模型通过最小二乘法等技术,根据输入的数据计算小麦发病率预测值,从而得出最终结果。通过这样的过程,模型能够将多个输入变量综合考虑,准确预测小麦发病率,提高农民的收入和粮食生产能力。通过调查采集小麦数据,并使用传统算法和多元线性回归算法预测小麦发病率。该模型的输入为抗病评分、种植密度、叶片颜色指数(SPAD)、株高(cm)、病虫害类型、生育期(天)、分蘖数。多元线性回归算法通过分析这些输入变量与小麦发病率之间的线性关系,确定每个变量的权重系数。在模型训练过程中,算法会利用小麦发病率实际值进行优化,调整权重系数以最小化预测误差。模型通过最小二乘法等技术,根据输入的数据计算小麦发病率预测值,从而得出最终结果。通过这样的过程,模型能够将多个输入变量综合考虑,准确预测小麦发病率,提高农民的收入和粮食生产能力。
This dataset is compiled by collecting wheat-related data via field surveys, and traditional algorithms and multiple linear regression are employed to predict wheat disease incidence. The input features of the model include disease resistance score, planting density, Soil and Plant Analyzer Development (SPAD) value (leaf color index), plant height (cm), type of diseases and insect pests, growth period (days), and tiller number. The multiple linear regression algorithm analyzes the linear relationship between these input variables and wheat disease incidence to determine the weight coefficient of each variable. During model training, the algorithm optimizes by leveraging the actual values of wheat disease incidence, adjusting the weight coefficients to minimize prediction errors. The model calculates the predicted wheat disease incidence based on input data using techniques such as the least squares method, thereby generating the final prediction results. Through this process, the model comprehensively considers multiple input variables to accurately predict wheat disease incidence, which can enhance farmers' income and grain production capacity.
This dataset is compiled by collecting wheat-related data via field surveys, and traditional algorithms and multiple linear regression are employed to predict wheat disease incidence. The input features of the model include disease resistance score, planting density, Soil and Plant Analyzer Development (SPAD) value (leaf color index), plant height (cm), type of diseases and insect pests, growth period (days), and tiller number. The multiple linear regression algorithm analyzes the linear relationship between these input variables and wheat disease incidence to determine the weight coefficient of each variable. During model training, the algorithm optimizes by leveraging the actual values of wheat disease incidence, adjusting the weight coefficients to minimize prediction errors. The model calculates the predicted wheat disease incidence based on input data using techniques such as the least squares method, thereby generating the final prediction results. Through this process, the model comprehensively considers multiple input variables to accurately predict wheat disease incidence, which can enhance farmers' income and grain production capacity.
提供机构:
杭州旭卉科技有限责任公司
创建时间:
2024-11-12
搜集汇总
数据集介绍
特点
该数据集包含4065条小麦成熟期发病率预测数据,每月更新,采用多元线性回归算法预测发病率,输入变量包括抗病评分、种植密度、叶片颜色指数等,旨在提高农民收入和粮食生产能力。
以上内容由遇见数据集搜集并总结生成


