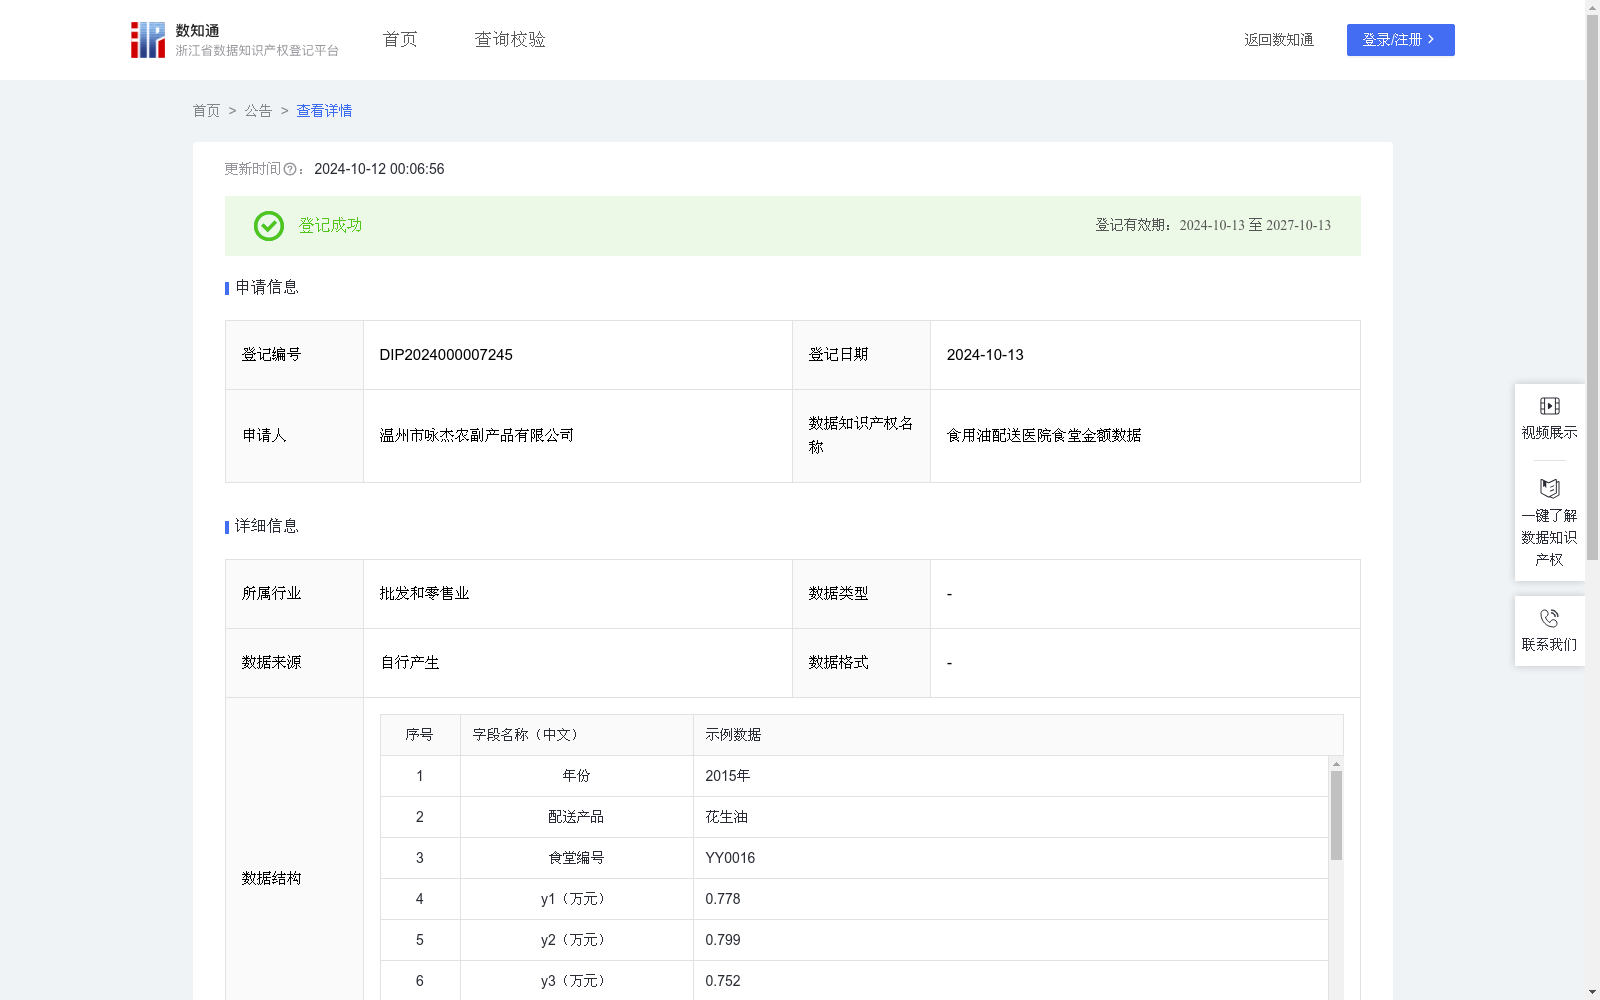
食用油配送医院食堂金额数据
收藏浙江省数据知识产权登记平台2024-10-12 更新2024-10-14 收录
下载链接:
https://www.zjip.org.cn/home/announce/trends/70167
下载链接
链接失效反馈官方服务:
资源简介:
通过配送管理系统软件采集本公司食用油配送医院食堂订单信息,将不同的配送订单以各医院食堂来划分,从而计算各个医院食堂每个月的配送金额数据,再计算出各年度的配送金额的方差大小,方差大小用来评价各个医院食堂的配送情况,从而用于评估所有医院食堂的采购和配送策略,所有企业可以通过该数据了解食用油在不同医院食堂的配送行情,以平衡采购和配送食用油数量。例如对于超平稳型食堂,本行业内企业无需时时关注该医院食堂的行情,可每月保持好食用油的采购和配送数量;对于一般平稳型食堂,本行业内企业需每季度关注该医院食堂的行情,适当调整食用油的采购和配送数量;而对于波动型食堂,本行业内企业需每月时时关注该医院食堂行情,了解该医院食堂的配送行情变化,以适应大幅度调整食用油的采购和配送数量变化。其次,本数据还能为配送行业的相关企业(如物流公司、农贸市场等)提供整体性参考,从而有效洞察市场趋势,更好地做出科学的营销决策。步骤1:通过配送管理系统软件采集本公司食用油配送医院食堂的订单信息,将不同的配送订单以各医院食堂来划分归类,从而将各年度每个月配送至医院食堂的金额,从一月至十二月依次用y1,y2...y12表示,并汇总计算得到各个医院食堂当年的总配送金额y。步骤2:计算各医院食堂的月平均配送金额y̅=各个医院食堂当年的总配送金额y/12。步骤3:根据方差公式计算方差s2={(y1-y̅)^2+(y2-y̅)^2+(y3-y̅)^2+…+(y12-y̅)^2}/12,从而得到各个医院食堂配送金额的方差s2大小。步骤4:当方差s2小于0.01评价该医院食堂为超平稳型食堂。当方差s2大于等于0.01并且小于等于0.03评价该医院食堂为一般平稳型食堂。当方差s2大于0.03评价该医院食堂为波动型食堂。
This dataset collects order information of edible oil deliveries from the company to hospital canteens via distribution management system software. Delivery orders are categorized by each target hospital canteen, so as to calculate the monthly delivery amount data for each hospital canteen, then compute the variance of annual delivery amounts. The variance is used to evaluate the delivery performance for each hospital canteen, thereby supporting the evaluation of procurement and distribution strategies for all hospital canteens. Enterprises in the industry can use this data to understand the delivery market trends of edible oil across different hospital canteens, so as to balance the quantity of edible oil procurement and distribution. For example, for ultra-stable canteens, enterprises in the industry do not need to pay constant attention to their market trends, and can maintain consistent procurement and delivery quantities of edible oil each month; for general stable canteens, enterprises need to pay attention to their market trends quarterly and appropriately adjust the procurement and delivery quantities; for volatile canteens, enterprises need to monitor their market trends monthly to track changes in delivery conditions, so as to make substantial adjustments to edible oil procurement and delivery quantities.
In addition, this dataset can also provide holistic reference for relevant enterprises in the delivery industry, such as logistics companies and agricultural wholesale markets, enabling them to effectively gain insights into market trends and make more scientific marketing decisions.
Step 1: Collect order information of the company's edible oil deliveries to hospital canteens via distribution management system software, categorize different delivery orders by each hospital canteen. Thus, the monthly delivery amounts to hospital canteens from January to December of each year are denoted as y1, y2, ..., y12 in sequence, and the total annual delivery amount y for each hospital canteen is calculated via summarization.
Step 2: Calculate the monthly average delivery amount ȳ of each hospital canteen, which equals the total annual delivery amount y divided by 12.
Step 3: Compute the variance s² using the variance formula: s² = [(y1-ȳ)² + (y2-ȳ)² + (y3-ȳ)² + … + (y12-ȳ)²]/12, thereby obtaining the variance s² of the delivery amounts for each hospital canteen.
Step 4: Classify the hospital canteen as ultra-stable when the variance s² is less than 0.01; classify it as general stable when 0.01 ≤ s² ≤ 0.03; classify it as volatile when the variance s² is greater than 0.03.
提供机构:
温州市咏杰农副产品有限公司
创建时间:
2024-08-29
搜集汇总
数据集介绍
以上内容由遇见数据集搜集并总结生成


